Immigrants from Kuwait vs Subsaharan African Single Male Poverty
COMPARE
Immigrants from Kuwait
Subsaharan African
Single Male Poverty
Single Male Poverty Comparison
Immigrants from Kuwait
Sub-Saharan Africans
12.9%
SINGLE MALE POVERTY
31.9/ 100
METRIC RATING
187th/ 347
METRIC RANK
13.7%
SINGLE MALE POVERTY
0.5/ 100
METRIC RATING
254th/ 347
METRIC RANK
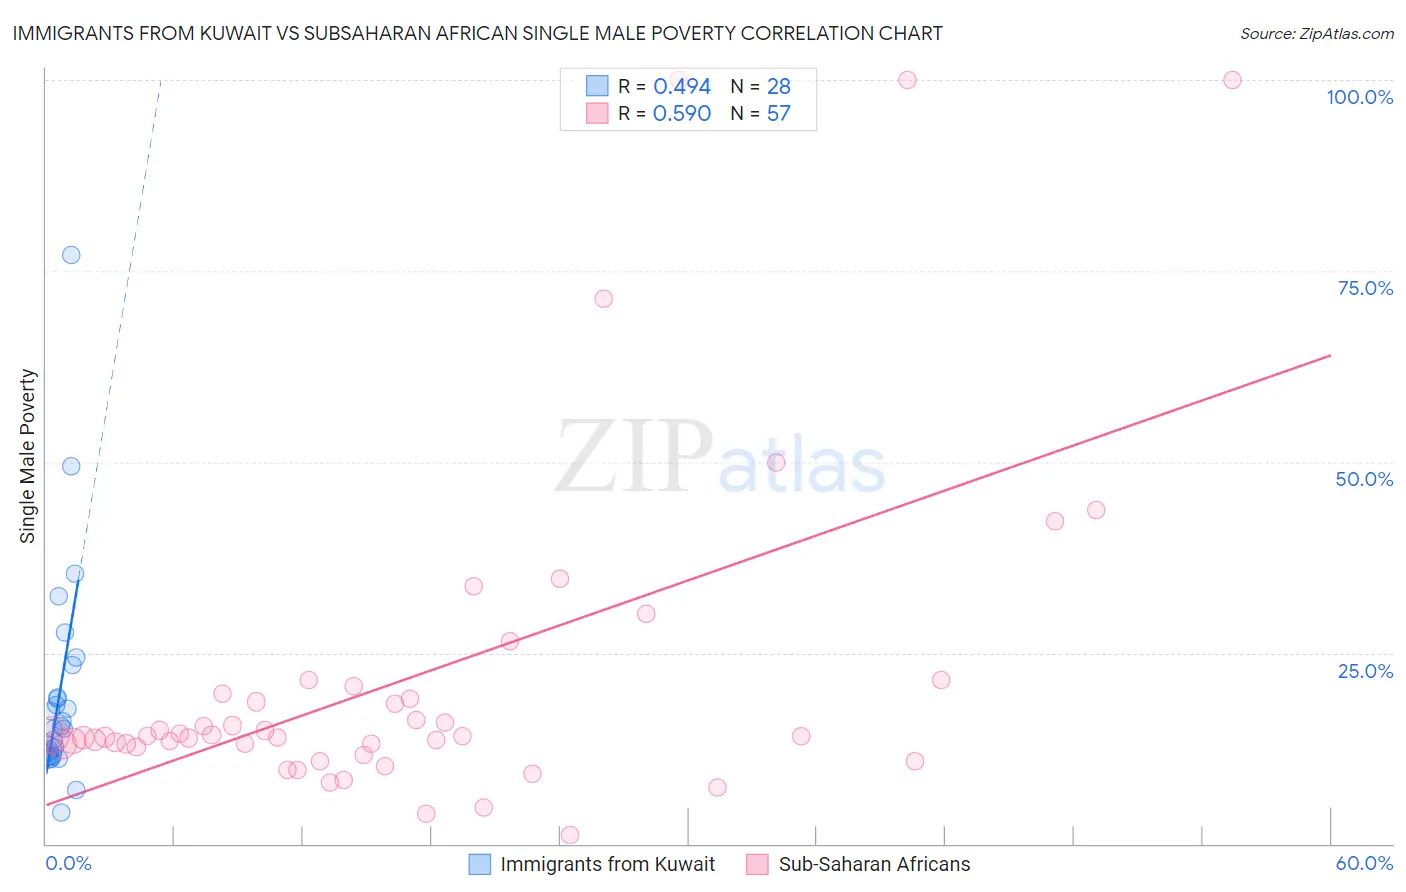
Immigrants from Kuwait vs Subsaharan African Single Male Poverty Correlation Chart
The statistical analysis conducted on geographies consisting of 129,103,469 people shows a moderate positive correlation between the proportion of Immigrants from Kuwait and poverty level among single males in the United States with a correlation coefficient (R) of 0.494 and weighted average of 12.9%. Similarly, the statistical analysis conducted on geographies consisting of 440,120,617 people shows a substantial positive correlation between the proportion of Sub-Saharan Africans and poverty level among single males in the United States with a correlation coefficient (R) of 0.590 and weighted average of 13.7%, a difference of 6.0%.
Single Male Poverty Correlation Summary
| Measurement | Immigrants from Kuwait | Subsaharan African |
| Minimum | 4.1% | 1.1% |
| Maximum | 77.0% | 100.0% |
| Range | 73.0% | 98.9% |
| Mean | 19.7% | 21.8% |
| Median | 15.2% | 14.1% |
| Interquartile 25% (IQ1) | 11.7% | 12.8% |
| Interquartile 75% (IQ3) | 21.3% | 20.1% |
| Interquartile Range (IQR) | 9.6% | 7.3% |
| Standard Deviation (Sample) | 14.6% | 22.0% |
| Standard Deviation (Population) | 14.4% | 21.8% |
Similar Demographics by Single Male Poverty
Demographics Similar to Immigrants from Kuwait by Single Male Poverty
In terms of single male poverty, the demographic groups most similar to Immigrants from Kuwait are Nigerian (12.9%, a difference of 0.0%), Norwegian (12.9%, a difference of 0.010%), Macedonian (12.9%, a difference of 0.020%), Immigrants from Trinidad and Tobago (12.9%, a difference of 0.040%), and Immigrants from West Indies (12.9%, a difference of 0.060%).
| Demographics | Rating | Rank | Single Male Poverty |
| Immigrants | North America | 37.7 /100 | #180 | Fair 12.9% |
| Panamanians | 37.6 /100 | #181 | Fair 12.9% |
| Moroccans | 36.8 /100 | #182 | Fair 12.9% |
| Immigrants | West Indies | 33.0 /100 | #183 | Fair 12.9% |
| Immigrants | Trinidad and Tobago | 32.5 /100 | #184 | Fair 12.9% |
| Norwegians | 32.0 /100 | #185 | Fair 12.9% |
| Nigerians | 31.9 /100 | #186 | Fair 12.9% |
| Immigrants | Kuwait | 31.9 /100 | #187 | Fair 12.9% |
| Macedonians | 31.5 /100 | #188 | Fair 12.9% |
| Portuguese | 30.2 /100 | #189 | Fair 12.9% |
| Arabs | 27.0 /100 | #190 | Fair 13.0% |
| Immigrants | Thailand | 26.6 /100 | #191 | Fair 13.0% |
| Immigrants | Jamaica | 26.5 /100 | #192 | Fair 13.0% |
| Immigrants | South Africa | 26.1 /100 | #193 | Fair 13.0% |
| Liberians | 25.2 /100 | #194 | Fair 13.0% |
Demographics Similar to Sub-Saharan Africans by Single Male Poverty
In terms of single male poverty, the demographic groups most similar to Sub-Saharan Africans are Spaniard (13.7%, a difference of 0.11%), Immigrants from Belize (13.7%, a difference of 0.21%), Immigrants from Central America (13.8%, a difference of 0.40%), Immigrants from Guatemala (13.8%, a difference of 0.47%), and Guatemalan (13.8%, a difference of 0.51%).
| Demographics | Rating | Rank | Single Male Poverty |
| Belgians | 1.2 /100 | #247 | Tragic 13.5% |
| Czechs | 1.2 /100 | #248 | Tragic 13.5% |
| Spanish | 1.0 /100 | #249 | Tragic 13.6% |
| Immigrants | Somalia | 1.0 /100 | #250 | Tragic 13.6% |
| Immigrants | Zaire | 0.9 /100 | #251 | Tragic 13.6% |
| Finns | 0.9 /100 | #252 | Tragic 13.6% |
| German Russians | 0.8 /100 | #253 | Tragic 13.6% |
| Sub-Saharan Africans | 0.5 /100 | #254 | Tragic 13.7% |
| Spaniards | 0.4 /100 | #255 | Tragic 13.7% |
| Immigrants | Belize | 0.4 /100 | #256 | Tragic 13.7% |
| Immigrants | Central America | 0.3 /100 | #257 | Tragic 13.8% |
| Immigrants | Guatemala | 0.3 /100 | #258 | Tragic 13.8% |
| Guatemalans | 0.3 /100 | #259 | Tragic 13.8% |
| Swiss | 0.3 /100 | #260 | Tragic 13.8% |
| Hungarians | 0.3 /100 | #261 | Tragic 13.8% |