Immigrants from Germany vs Subsaharan African Single Male Poverty
COMPARE
Immigrants from Germany
Subsaharan African
Single Male Poverty
Single Male Poverty Comparison
Immigrants from Germany
Sub-Saharan Africans
13.4%
SINGLE MALE POVERTY
2.1/ 100
METRIC RATING
241st/ 347
METRIC RANK
13.7%
SINGLE MALE POVERTY
0.5/ 100
METRIC RATING
254th/ 347
METRIC RANK
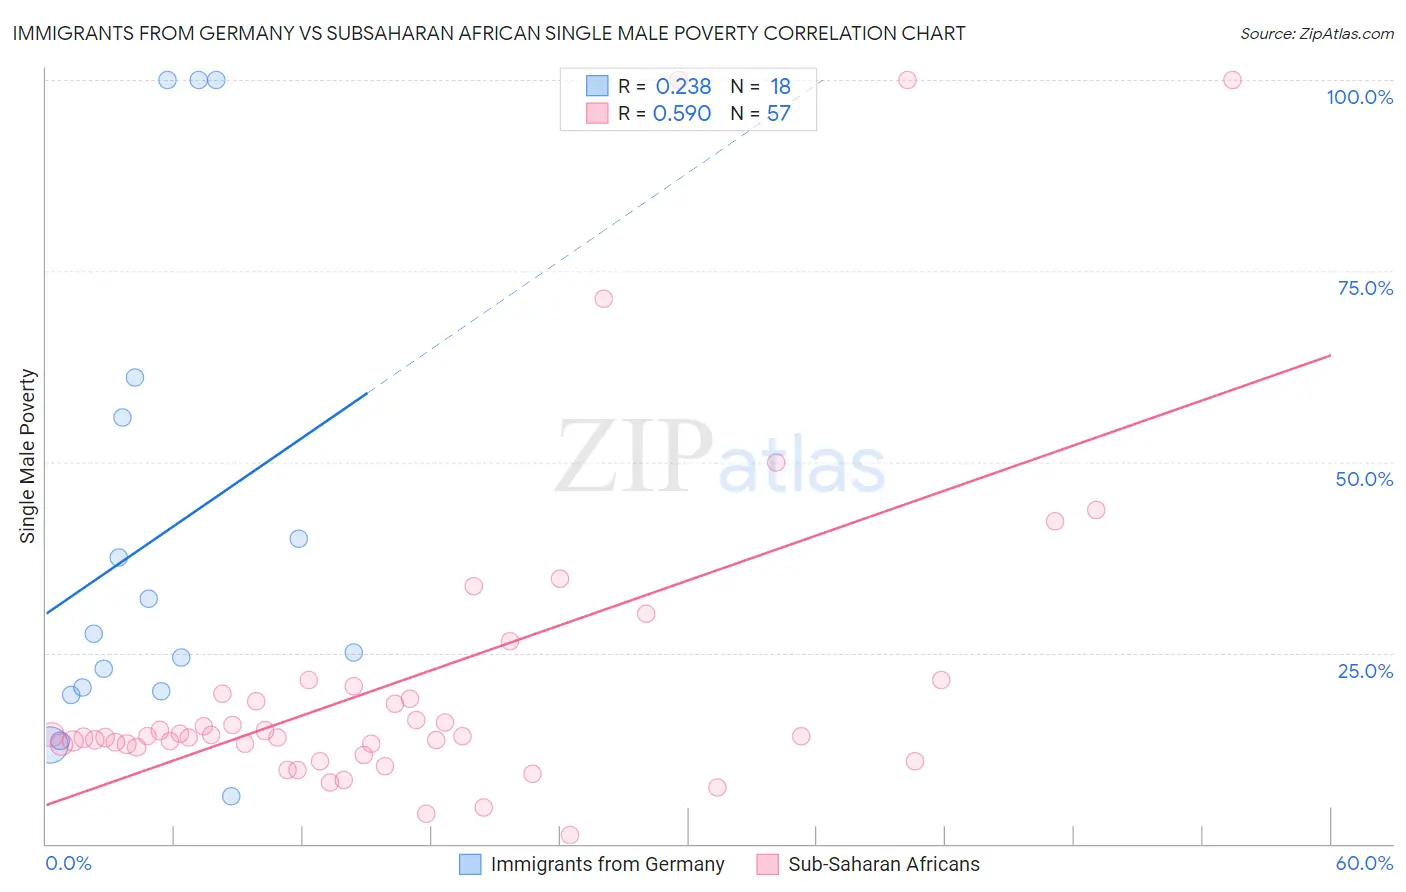
Immigrants from Germany vs Subsaharan African Single Male Poverty Correlation Chart
The statistical analysis conducted on geographies consisting of 402,484,283 people shows a weak positive correlation between the proportion of Immigrants from Germany and poverty level among single males in the United States with a correlation coefficient (R) of 0.238 and weighted average of 13.4%. Similarly, the statistical analysis conducted on geographies consisting of 440,120,617 people shows a substantial positive correlation between the proportion of Sub-Saharan Africans and poverty level among single males in the United States with a correlation coefficient (R) of 0.590 and weighted average of 13.7%, a difference of 1.9%.
Single Male Poverty Correlation Summary
| Measurement | Immigrants from Germany | Subsaharan African |
| Minimum | 6.2% | 1.1% |
| Maximum | 100.0% | 100.0% |
| Range | 93.8% | 98.9% |
| Mean | 39.9% | 21.8% |
| Median | 26.2% | 14.1% |
| Interquartile 25% (IQ1) | 19.9% | 12.8% |
| Interquartile 75% (IQ3) | 55.8% | 20.1% |
| Interquartile Range (IQR) | 35.9% | 7.3% |
| Standard Deviation (Sample) | 30.9% | 22.0% |
| Standard Deviation (Population) | 30.1% | 21.8% |
Demographics Similar to Immigrants from Germany and Sub-Saharan Africans by Single Male Poverty
In terms of single male poverty, the demographic groups most similar to Immigrants from Germany are Carpatho Rusyn (13.4%, a difference of 0.010%), Barbadian (13.4%, a difference of 0.060%), Belizean (13.4%, a difference of 0.11%), Immigrants from Senegal (13.5%, a difference of 0.33%), and Czechoslovakian (13.4%, a difference of 0.42%). Similarly, the demographic groups most similar to Sub-Saharan Africans are Spaniard (13.7%, a difference of 0.11%), Immigrants from Belize (13.7%, a difference of 0.21%), Immigrants from Central America (13.8%, a difference of 0.40%), German Russian (13.6%, a difference of 0.59%), and Finnish (13.6%, a difference of 0.74%).
| Demographics | Rating | Rank | Single Male Poverty |
| British West Indians | 3.4 /100 | #237 | Tragic 13.4% |
| Immigrants | Ghana | 3.2 /100 | #238 | Tragic 13.4% |
| Czechoslovakians | 3.0 /100 | #239 | Tragic 13.4% |
| Belizeans | 2.3 /100 | #240 | Tragic 13.4% |
| Immigrants | Germany | 2.1 /100 | #241 | Tragic 13.4% |
| Carpatho Rusyns | 2.1 /100 | #242 | Tragic 13.4% |
| Barbadians | 2.1 /100 | #243 | Tragic 13.4% |
| Immigrants | Senegal | 1.7 /100 | #244 | Tragic 13.5% |
| Immigrants | Latin America | 1.3 /100 | #245 | Tragic 13.5% |
| Immigrants | Micronesia | 1.2 /100 | #246 | Tragic 13.5% |
| Belgians | 1.2 /100 | #247 | Tragic 13.5% |
| Czechs | 1.2 /100 | #248 | Tragic 13.5% |
| Spanish | 1.0 /100 | #249 | Tragic 13.6% |
| Immigrants | Somalia | 1.0 /100 | #250 | Tragic 13.6% |
| Immigrants | Zaire | 0.9 /100 | #251 | Tragic 13.6% |
| Finns | 0.9 /100 | #252 | Tragic 13.6% |
| German Russians | 0.8 /100 | #253 | Tragic 13.6% |
| Sub-Saharan Africans | 0.5 /100 | #254 | Tragic 13.7% |
| Spaniards | 0.4 /100 | #255 | Tragic 13.7% |
| Immigrants | Belize | 0.4 /100 | #256 | Tragic 13.7% |
| Immigrants | Central America | 0.3 /100 | #257 | Tragic 13.8% |