Immigrants from Cambodia vs Immigrants from Afghanistan Single Female Poverty
COMPARE
Immigrants from Cambodia
Immigrants from Afghanistan
Single Female Poverty
Single Female Poverty Comparison
Immigrants from Cambodia
Immigrants from Afghanistan
21.2%
SINGLE FEMALE POVERTY
38.2/ 100
METRIC RATING
185th/ 347
METRIC RANK
20.0%
SINGLE FEMALE POVERTY
95.4/ 100
METRIC RATING
118th/ 347
METRIC RANK
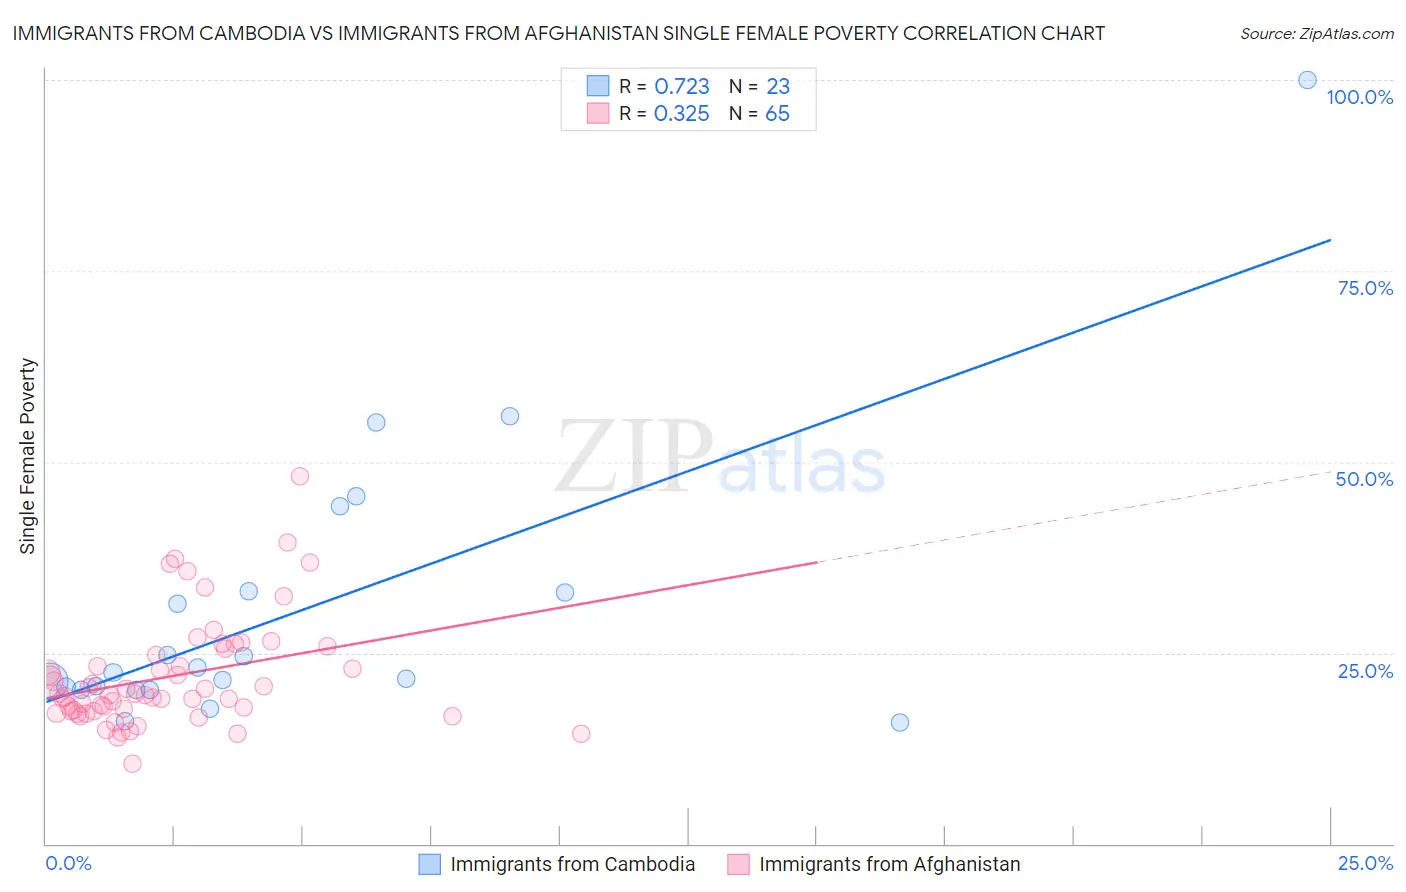
Immigrants from Cambodia vs Immigrants from Afghanistan Single Female Poverty Correlation Chart
The statistical analysis conducted on geographies consisting of 204,042,246 people shows a strong positive correlation between the proportion of Immigrants from Cambodia and poverty level among single females in the United States with a correlation coefficient (R) of 0.723 and weighted average of 21.2%. Similarly, the statistical analysis conducted on geographies consisting of 146,836,819 people shows a mild positive correlation between the proportion of Immigrants from Afghanistan and poverty level among single females in the United States with a correlation coefficient (R) of 0.325 and weighted average of 20.0%, a difference of 5.7%.
Single Female Poverty Correlation Summary
| Measurement | Immigrants from Cambodia | Immigrants from Afghanistan |
| Minimum | 15.9% | 10.5% |
| Maximum | 100.0% | 48.1% |
| Range | 84.1% | 37.7% |
| Mean | 30.8% | 21.8% |
| Median | 22.4% | 19.5% |
| Interquartile 25% (IQ1) | 20.2% | 17.3% |
| Interquartile 75% (IQ3) | 33.1% | 25.1% |
| Interquartile Range (IQR) | 12.9% | 7.8% |
| Standard Deviation (Sample) | 19.1% | 7.1% |
| Standard Deviation (Population) | 18.7% | 7.0% |
Similar Demographics by Single Female Poverty
Demographics Similar to Immigrants from Cambodia by Single Female Poverty
In terms of single female poverty, the demographic groups most similar to Immigrants from Cambodia are Hawaiian (21.2%, a difference of 0.040%), Hungarian (21.1%, a difference of 0.090%), Slovak (21.1%, a difference of 0.10%), Immigrants from Nigeria (21.2%, a difference of 0.10%), and Slavic (21.1%, a difference of 0.15%).
| Demographics | Rating | Rank | Single Female Poverty |
| Immigrants | Bosnia and Herzegovina | 44.9 /100 | #178 | Average 21.1% |
| British | 42.9 /100 | #179 | Average 21.1% |
| Spanish American Indians | 42.5 /100 | #180 | Average 21.1% |
| Europeans | 42.3 /100 | #181 | Average 21.1% |
| Slavs | 40.5 /100 | #182 | Average 21.1% |
| Slovaks | 39.7 /100 | #183 | Fair 21.1% |
| Hungarians | 39.6 /100 | #184 | Fair 21.1% |
| Immigrants | Cambodia | 38.2 /100 | #185 | Fair 21.2% |
| Hawaiians | 37.7 /100 | #186 | Fair 21.2% |
| Immigrants | Nigeria | 36.8 /100 | #187 | Fair 21.2% |
| Yugoslavians | 35.4 /100 | #188 | Fair 21.2% |
| Immigrants | Cuba | 35.3 /100 | #189 | Fair 21.2% |
| Trinidadians and Tobagonians | 35.2 /100 | #190 | Fair 21.2% |
| Immigrants | Germany | 31.1 /100 | #191 | Fair 21.3% |
| Immigrants | Jamaica | 30.5 /100 | #192 | Fair 21.3% |
Demographics Similar to Immigrants from Afghanistan by Single Female Poverty
In terms of single female poverty, the demographic groups most similar to Immigrants from Afghanistan are Immigrants from Ethiopia (20.0%, a difference of 0.0%), Polish (20.0%, a difference of 0.080%), South American (20.0%, a difference of 0.10%), Immigrants from Kazakhstan (20.0%, a difference of 0.12%), and Immigrants from Switzerland (20.0%, a difference of 0.13%).
| Demographics | Rating | Rank | Single Female Poverty |
| Carpatho Rusyns | 96.1 /100 | #111 | Exceptional 20.0% |
| Immigrants | Netherlands | 96.0 /100 | #112 | Exceptional 20.0% |
| Immigrants | Zimbabwe | 95.9 /100 | #113 | Exceptional 20.0% |
| Immigrants | Colombia | 95.9 /100 | #114 | Exceptional 20.0% |
| Immigrants | Northern Africa | 95.8 /100 | #115 | Exceptional 20.0% |
| Immigrants | Kazakhstan | 95.7 /100 | #116 | Exceptional 20.0% |
| Poles | 95.6 /100 | #117 | Exceptional 20.0% |
| Immigrants | Afghanistan | 95.4 /100 | #118 | Exceptional 20.0% |
| Immigrants | Ethiopia | 95.4 /100 | #119 | Exceptional 20.0% |
| South Americans | 95.1 /100 | #120 | Exceptional 20.0% |
| Immigrants | Switzerland | 95.1 /100 | #121 | Exceptional 20.0% |
| Immigrants | South America | 95.0 /100 | #122 | Exceptional 20.0% |
| Brazilians | 94.4 /100 | #123 | Exceptional 20.1% |
| Immigrants | Chile | 94.3 /100 | #124 | Exceptional 20.1% |
| Immigrants | South Africa | 93.9 /100 | #125 | Exceptional 20.1% |