Immigrants from Cambodia vs Immigrants from Costa Rica Single Female Poverty
COMPARE
Immigrants from Cambodia
Immigrants from Costa Rica
Single Female Poverty
Single Female Poverty Comparison
Immigrants from Cambodia
Immigrants from Costa Rica
21.2%
SINGLE FEMALE POVERTY
38.2/ 100
METRIC RATING
185th/ 347
METRIC RANK
20.9%
SINGLE FEMALE POVERTY
61.5/ 100
METRIC RATING
168th/ 347
METRIC RANK
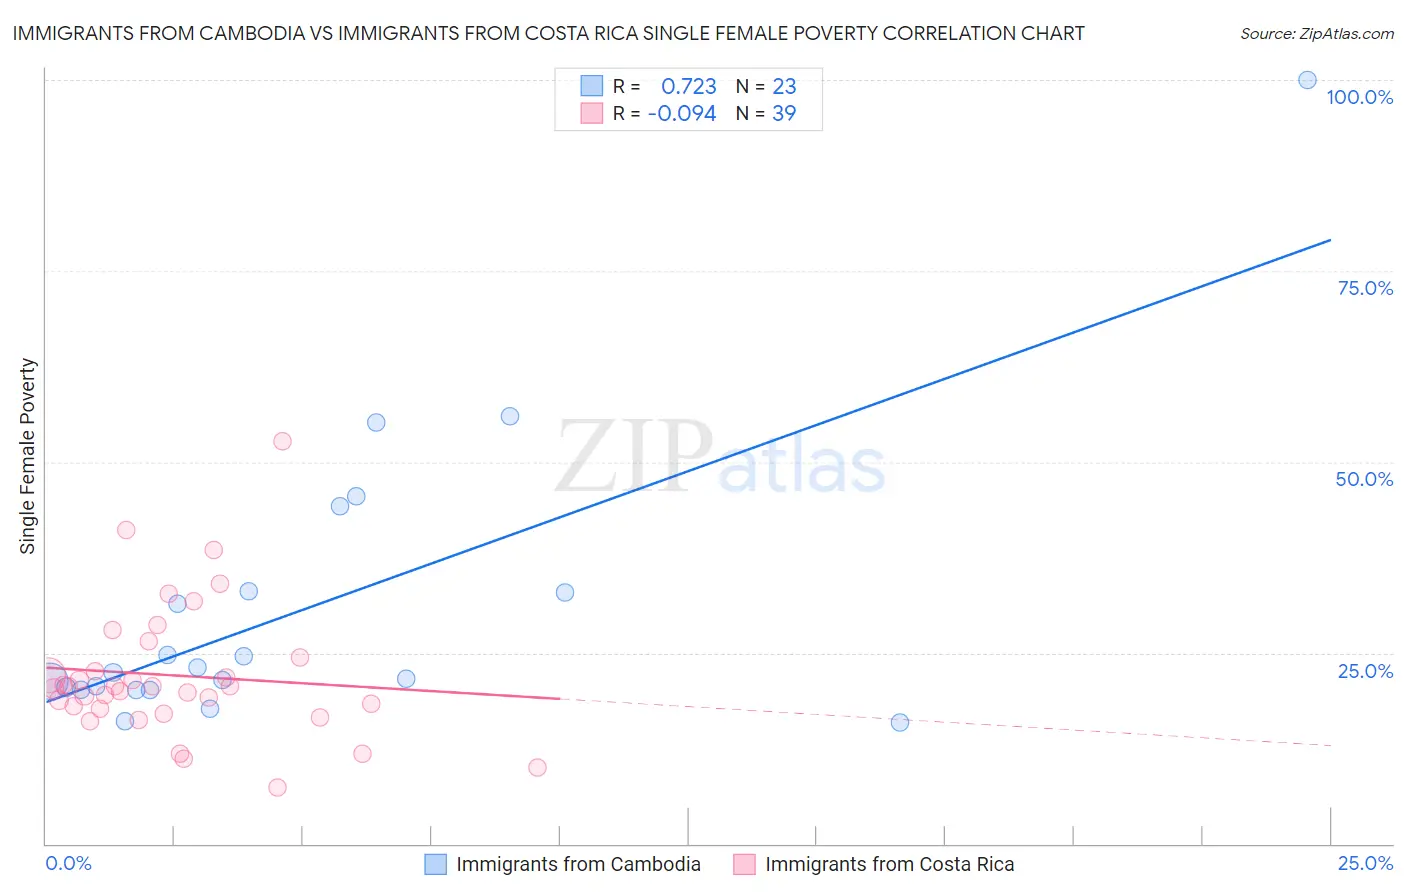
Immigrants from Cambodia vs Immigrants from Costa Rica Single Female Poverty Correlation Chart
The statistical analysis conducted on geographies consisting of 204,042,246 people shows a strong positive correlation between the proportion of Immigrants from Cambodia and poverty level among single females in the United States with a correlation coefficient (R) of 0.723 and weighted average of 21.2%. Similarly, the statistical analysis conducted on geographies consisting of 202,952,607 people shows a slight negative correlation between the proportion of Immigrants from Costa Rica and poverty level among single females in the United States with a correlation coefficient (R) of -0.094 and weighted average of 20.9%, a difference of 1.5%.
Single Female Poverty Correlation Summary
| Measurement | Immigrants from Cambodia | Immigrants from Costa Rica |
| Minimum | 15.9% | 7.4% |
| Maximum | 100.0% | 52.6% |
| Range | 84.1% | 45.2% |
| Mean | 30.8% | 22.0% |
| Median | 22.4% | 20.6% |
| Interquartile 25% (IQ1) | 20.2% | 17.6% |
| Interquartile 75% (IQ3) | 33.1% | 24.4% |
| Interquartile Range (IQR) | 12.9% | 6.8% |
| Standard Deviation (Sample) | 19.1% | 8.8% |
| Standard Deviation (Population) | 18.7% | 8.7% |
Demographics Similar to Immigrants from Cambodia and Immigrants from Costa Rica by Single Female Poverty
In terms of single female poverty, the demographic groups most similar to Immigrants from Cambodia are Hawaiian (21.2%, a difference of 0.040%), Hungarian (21.1%, a difference of 0.090%), Slovak (21.1%, a difference of 0.10%), Slavic (21.1%, a difference of 0.15%), and European (21.1%, a difference of 0.26%). Similarly, the demographic groups most similar to Immigrants from Costa Rica are Immigrants from Norway (20.8%, a difference of 0.090%), Norwegian (20.8%, a difference of 0.10%), Immigrants from Trinidad and Tobago (20.9%, a difference of 0.34%), New Zealander (21.0%, a difference of 0.54%), and Moroccan (21.0%, a difference of 0.56%).
| Demographics | Rating | Rank | Single Female Poverty |
| Norwegians | 63.0 /100 | #166 | Good 20.8% |
| Immigrants | Norway | 63.0 /100 | #167 | Good 20.8% |
| Immigrants | Costa Rica | 61.5 /100 | #168 | Good 20.9% |
| Immigrants | Trinidad and Tobago | 56.3 /100 | #169 | Average 20.9% |
| New Zealanders | 53.2 /100 | #170 | Average 21.0% |
| Moroccans | 52.8 /100 | #171 | Average 21.0% |
| Guyanese | 52.0 /100 | #172 | Average 21.0% |
| Immigrants | Guyana | 50.6 /100 | #173 | Average 21.0% |
| Cubans | 50.0 /100 | #174 | Average 21.0% |
| Czechs | 46.8 /100 | #175 | Average 21.0% |
| Canadians | 45.4 /100 | #176 | Average 21.1% |
| Scandinavians | 45.2 /100 | #177 | Average 21.1% |
| Immigrants | Bosnia and Herzegovina | 44.9 /100 | #178 | Average 21.1% |
| British | 42.9 /100 | #179 | Average 21.1% |
| Spanish American Indians | 42.5 /100 | #180 | Average 21.1% |
| Europeans | 42.3 /100 | #181 | Average 21.1% |
| Slavs | 40.5 /100 | #182 | Average 21.1% |
| Slovaks | 39.7 /100 | #183 | Fair 21.1% |
| Hungarians | 39.6 /100 | #184 | Fair 21.1% |
| Immigrants | Cambodia | 38.2 /100 | #185 | Fair 21.2% |
| Hawaiians | 37.7 /100 | #186 | Fair 21.2% |