Ukrainian vs Immigrants from Afghanistan Single Female Poverty
COMPARE
Ukrainian
Immigrants from Afghanistan
Single Female Poverty
Single Female Poverty Comparison
Ukrainians
Immigrants from Afghanistan
19.8%
SINGLE FEMALE POVERTY
97.6/ 100
METRIC RATING
100th/ 347
METRIC RANK
20.0%
SINGLE FEMALE POVERTY
95.4/ 100
METRIC RATING
118th/ 347
METRIC RANK
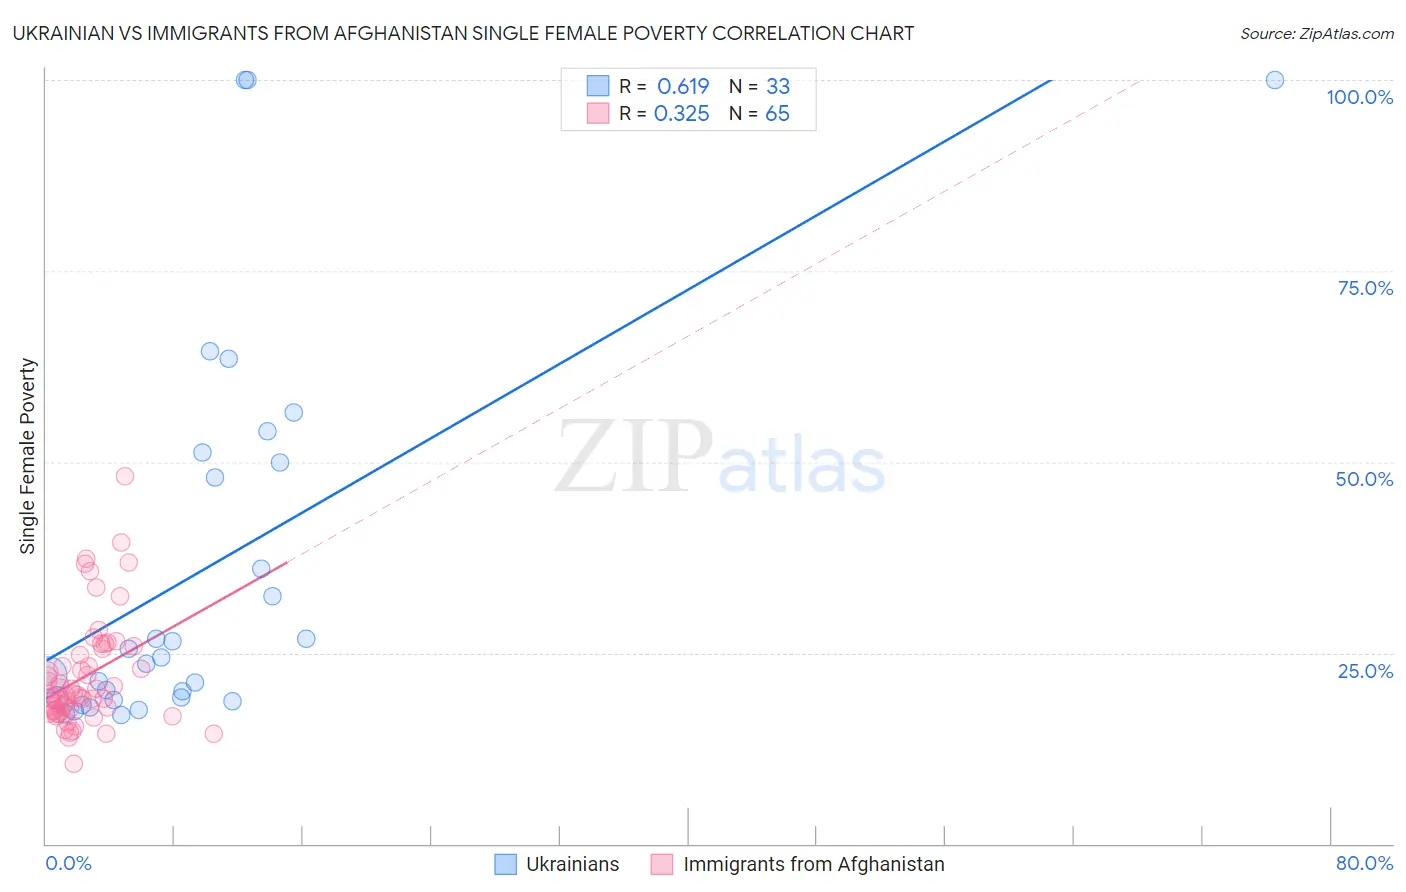
Ukrainian vs Immigrants from Afghanistan Single Female Poverty Correlation Chart
The statistical analysis conducted on geographies consisting of 437,822,135 people shows a significant positive correlation between the proportion of Ukrainians and poverty level among single females in the United States with a correlation coefficient (R) of 0.619 and weighted average of 19.8%. Similarly, the statistical analysis conducted on geographies consisting of 146,836,819 people shows a mild positive correlation between the proportion of Immigrants from Afghanistan and poverty level among single females in the United States with a correlation coefficient (R) of 0.325 and weighted average of 20.0%, a difference of 1.1%.
Single Female Poverty Correlation Summary
| Measurement | Ukrainian | Immigrants from Afghanistan |
| Minimum | 16.8% | 10.5% |
| Maximum | 100.0% | 48.1% |
| Range | 83.2% | 37.7% |
| Mean | 36.2% | 21.8% |
| Median | 24.4% | 19.5% |
| Interquartile 25% (IQ1) | 19.0% | 17.3% |
| Interquartile 75% (IQ3) | 50.6% | 25.1% |
| Interquartile Range (IQR) | 31.6% | 7.8% |
| Standard Deviation (Sample) | 25.1% | 7.1% |
| Standard Deviation (Population) | 24.8% | 7.0% |
Demographics Similar to Ukrainians and Immigrants from Afghanistan by Single Female Poverty
In terms of single female poverty, the demographic groups most similar to Ukrainians are Immigrants from Belgium (19.8%, a difference of 0.18%), Immigrants from Cameroon (19.8%, a difference of 0.19%), Sierra Leonean (19.7%, a difference of 0.25%), Immigrants from Southern Europe (19.9%, a difference of 0.31%), and Chilean (19.9%, a difference of 0.43%). Similarly, the demographic groups most similar to Immigrants from Afghanistan are Immigrants from Ethiopia (20.0%, a difference of 0.0%), Polish (20.0%, a difference of 0.080%), Immigrants from Kazakhstan (20.0%, a difference of 0.12%), Immigrants from Northern Africa (20.0%, a difference of 0.16%), and Immigrants from Colombia (20.0%, a difference of 0.17%).
| Demographics | Rating | Rank | Single Female Poverty |
| Sierra Leoneans | 97.9 /100 | #99 | Exceptional 19.7% |
| Ukrainians | 97.6 /100 | #100 | Exceptional 19.8% |
| Immigrants | Belgium | 97.3 /100 | #101 | Exceptional 19.8% |
| Immigrants | Cameroon | 97.3 /100 | #102 | Exceptional 19.8% |
| Immigrants | Southern Europe | 97.1 /100 | #103 | Exceptional 19.9% |
| Chileans | 96.9 /100 | #104 | Exceptional 19.9% |
| Israelis | 96.9 /100 | #105 | Exceptional 19.9% |
| Ethiopians | 96.7 /100 | #106 | Exceptional 19.9% |
| Immigrants | Syria | 96.7 /100 | #107 | Exceptional 19.9% |
| Native Hawaiians | 96.6 /100 | #108 | Exceptional 19.9% |
| Colombians | 96.6 /100 | #109 | Exceptional 19.9% |
| Immigrants | Western Asia | 96.5 /100 | #110 | Exceptional 19.9% |
| Carpatho Rusyns | 96.1 /100 | #111 | Exceptional 20.0% |
| Immigrants | Netherlands | 96.0 /100 | #112 | Exceptional 20.0% |
| Immigrants | Zimbabwe | 95.9 /100 | #113 | Exceptional 20.0% |
| Immigrants | Colombia | 95.9 /100 | #114 | Exceptional 20.0% |
| Immigrants | Northern Africa | 95.8 /100 | #115 | Exceptional 20.0% |
| Immigrants | Kazakhstan | 95.7 /100 | #116 | Exceptional 20.0% |
| Poles | 95.6 /100 | #117 | Exceptional 20.0% |
| Immigrants | Afghanistan | 95.4 /100 | #118 | Exceptional 20.0% |
| Immigrants | Ethiopia | 95.4 /100 | #119 | Exceptional 20.0% |