Immigrants from Cambodia vs Immigrants from Afghanistan Births to Unmarried Women
COMPARE
Immigrants from Cambodia
Immigrants from Afghanistan
Births to Unmarried Women
Births to Unmarried Women Comparison
Immigrants from Cambodia
Immigrants from Afghanistan
34.8%
BIRTHS TO UNMARRIED WOMEN
1.6/ 100
METRIC RATING
238th/ 347
METRIC RANK
28.7%
BIRTHS TO UNMARRIED WOMEN
98.1/ 100
METRIC RATING
80th/ 347
METRIC RANK
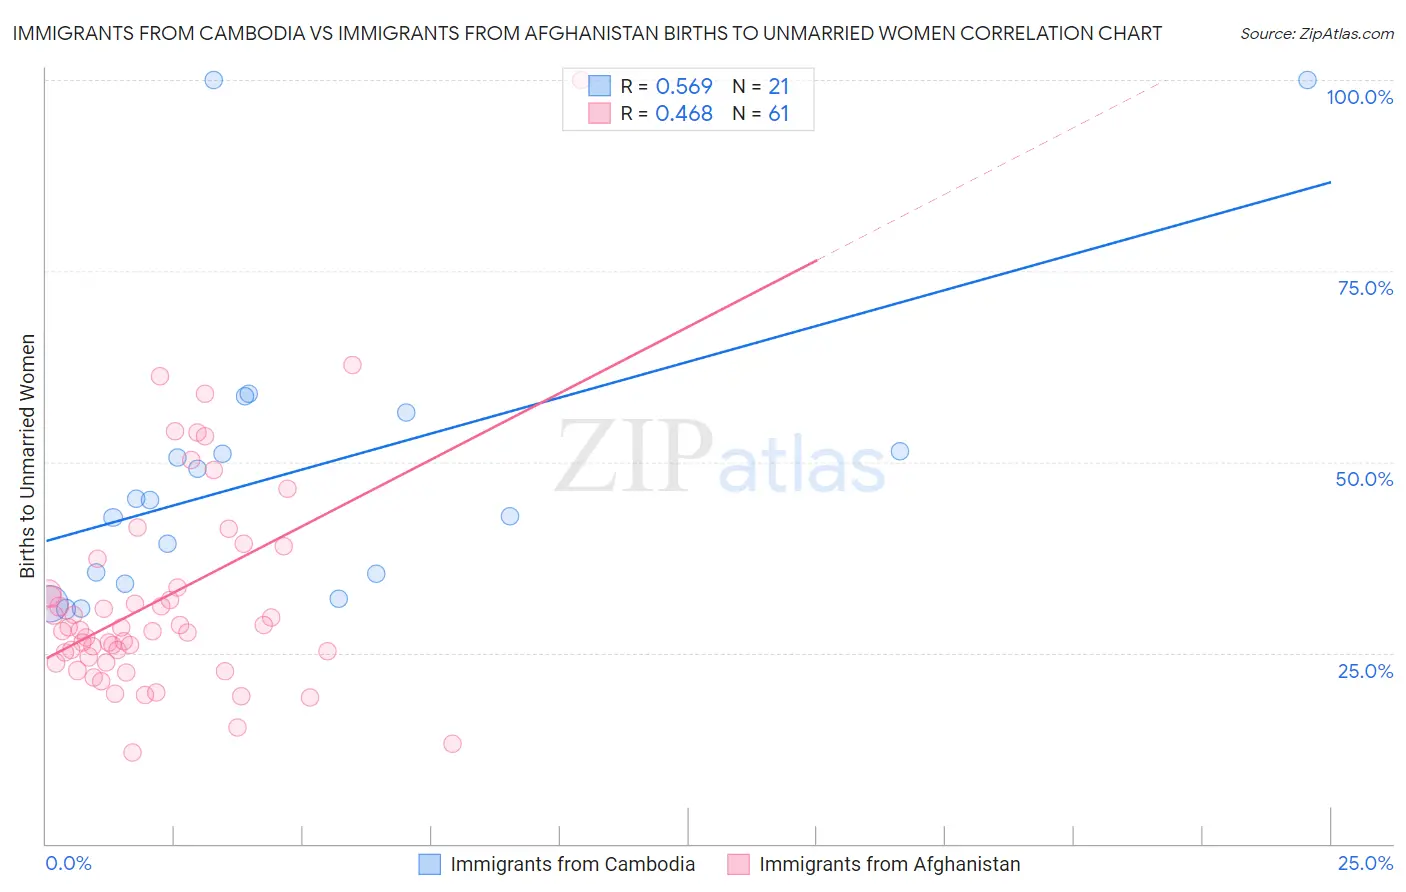
Immigrants from Cambodia vs Immigrants from Afghanistan Births to Unmarried Women Correlation Chart
The statistical analysis conducted on geographies consisting of 198,809,651 people shows a substantial positive correlation between the proportion of Immigrants from Cambodia and percentage of births to unmarried women in the United States with a correlation coefficient (R) of 0.569 and weighted average of 34.8%. Similarly, the statistical analysis conducted on geographies consisting of 143,617,588 people shows a moderate positive correlation between the proportion of Immigrants from Afghanistan and percentage of births to unmarried women in the United States with a correlation coefficient (R) of 0.468 and weighted average of 28.7%, a difference of 21.2%.
Births to Unmarried Women Correlation Summary
| Measurement | Immigrants from Cambodia | Immigrants from Afghanistan |
| Minimum | 30.7% | 11.9% |
| Maximum | 100.0% | 100.0% |
| Range | 69.3% | 88.1% |
| Mean | 48.6% | 32.2% |
| Median | 45.0% | 28.0% |
| Interquartile 25% (IQ1) | 34.6% | 24.1% |
| Interquartile 75% (IQ3) | 53.9% | 35.4% |
| Interquartile Range (IQR) | 19.3% | 11.4% |
| Standard Deviation (Sample) | 19.4% | 14.6% |
| Standard Deviation (Population) | 18.9% | 14.5% |
Similar Demographics by Births to Unmarried Women
Demographics Similar to Immigrants from Cambodia by Births to Unmarried Women
In terms of births to unmarried women, the demographic groups most similar to Immigrants from Cambodia are Marshallese (34.8%, a difference of 0.060%), Immigrants from Cameroon (34.7%, a difference of 0.13%), Sierra Leonean (34.9%, a difference of 0.22%), Immigrants from Middle Africa (34.9%, a difference of 0.47%), and Immigrants from Guyana (35.0%, a difference of 0.51%).
| Demographics | Rating | Rank | Births to Unmarried Women |
| Native Hawaiians | 2.9 /100 | #231 | Tragic 34.3% |
| French Canadians | 2.5 /100 | #232 | Tragic 34.4% |
| Bangladeshis | 2.5 /100 | #233 | Tragic 34.4% |
| Immigrants | Zaire | 2.3 /100 | #234 | Tragic 34.5% |
| Immigrants | Ghana | 2.2 /100 | #235 | Tragic 34.5% |
| Immigrants | Cameroon | 1.6 /100 | #236 | Tragic 34.7% |
| Marshallese | 1.6 /100 | #237 | Tragic 34.8% |
| Immigrants | Cambodia | 1.6 /100 | #238 | Tragic 34.8% |
| Sierra Leoneans | 1.4 /100 | #239 | Tragic 34.9% |
| Immigrants | Middle Africa | 1.2 /100 | #240 | Tragic 34.9% |
| Immigrants | Guyana | 1.2 /100 | #241 | Tragic 35.0% |
| Indonesians | 1.2 /100 | #242 | Tragic 35.0% |
| Japanese | 0.9 /100 | #243 | Tragic 35.2% |
| Guyanese | 0.9 /100 | #244 | Tragic 35.2% |
| Shoshone | 0.8 /100 | #245 | Tragic 35.3% |
Demographics Similar to Immigrants from Afghanistan by Births to Unmarried Women
In terms of births to unmarried women, the demographic groups most similar to Immigrants from Afghanistan are Danish (28.7%, a difference of 0.020%), Immigrants from Austria (28.7%, a difference of 0.040%), Zimbabwean (28.7%, a difference of 0.050%), Romanian (28.7%, a difference of 0.15%), and Immigrants from Northern Europe (28.6%, a difference of 0.21%).
| Demographics | Rating | Rank | Births to Unmarried Women |
| Albanians | 98.5 /100 | #73 | Exceptional 28.5% |
| Immigrants | Bolivia | 98.5 /100 | #74 | Exceptional 28.6% |
| Immigrants | Switzerland | 98.4 /100 | #75 | Exceptional 28.6% |
| Israelis | 98.4 /100 | #76 | Exceptional 28.6% |
| Immigrants | Northern Europe | 98.3 /100 | #77 | Exceptional 28.6% |
| Zimbabweans | 98.2 /100 | #78 | Exceptional 28.7% |
| Danes | 98.2 /100 | #79 | Exceptional 28.7% |
| Immigrants | Afghanistan | 98.1 /100 | #80 | Exceptional 28.7% |
| Immigrants | Austria | 98.1 /100 | #81 | Exceptional 28.7% |
| Romanians | 98.0 /100 | #82 | Exceptional 28.7% |
| Immigrants | Kuwait | 98.0 /100 | #83 | Exceptional 28.8% |
| Immigrants | Poland | 97.6 /100 | #84 | Exceptional 28.9% |
| Sri Lankans | 97.5 /100 | #85 | Exceptional 28.9% |
| Immigrants | Jordan | 97.4 /100 | #86 | Exceptional 29.0% |
| Taiwanese | 97.3 /100 | #87 | Exceptional 29.0% |