Immigrants from Burma/Myanmar vs Immigrants In Labor Force | Age 30-34
COMPARE
Immigrants from Burma/Myanmar
Immigrants
In Labor Force | Age 30-34
In Labor Force | Age 30-34 Comparison
Immigrants from Burma/Myanmar
Immigrants
84.7%
IN LABOR FORCE | AGE 30-34
52.0/ 100
METRIC RATING
170th/ 347
METRIC RANK
84.1%
IN LABOR FORCE | AGE 30-34
2.0/ 100
METRIC RATING
232nd/ 347
METRIC RANK
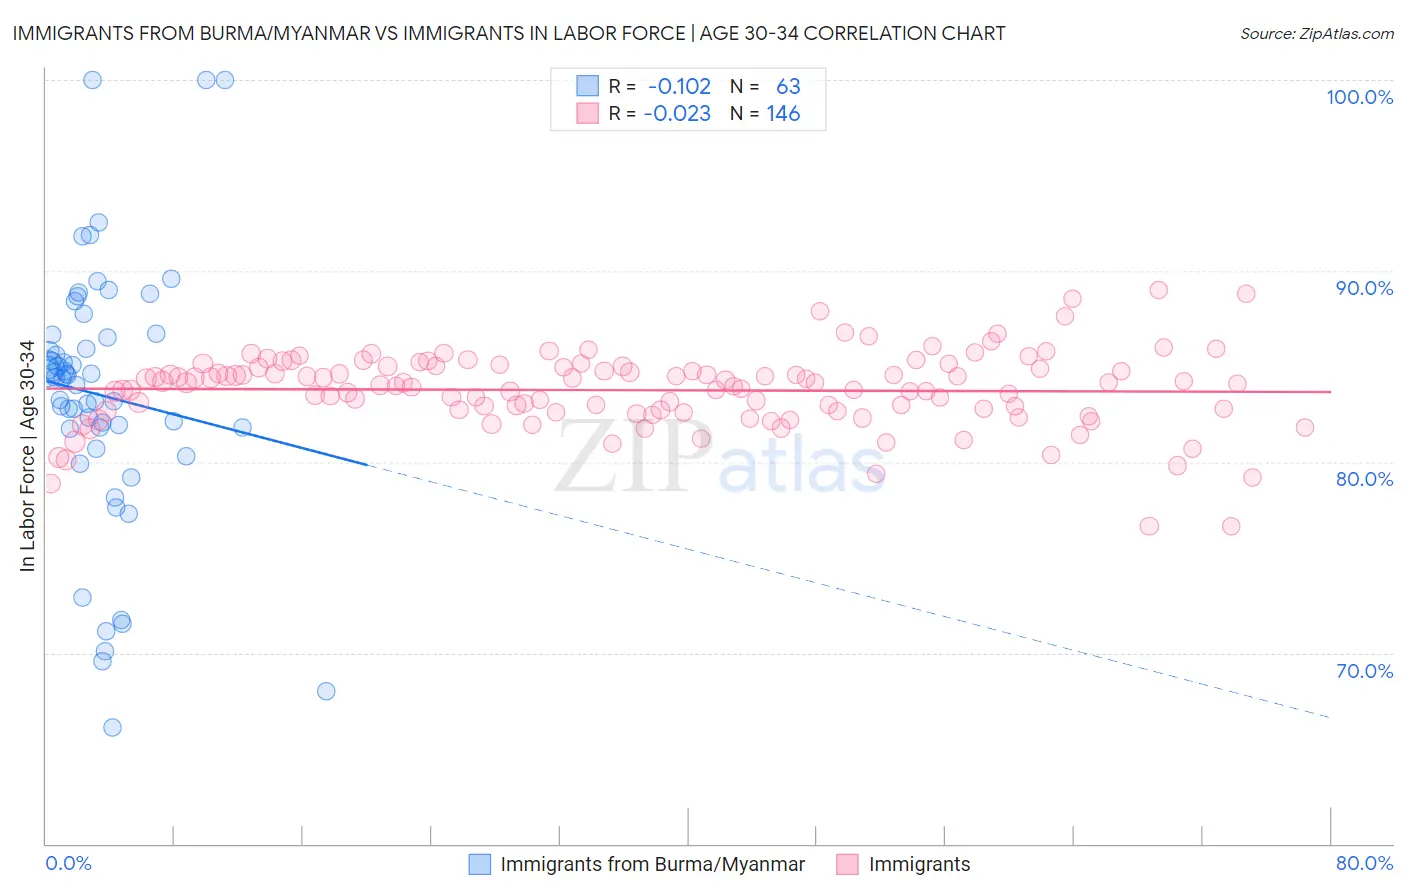
Immigrants from Burma/Myanmar vs Immigrants In Labor Force | Age 30-34 Correlation Chart
The statistical analysis conducted on geographies consisting of 172,303,659 people shows a poor negative correlation between the proportion of Immigrants from Burma/Myanmar and labor force participation rate among population between the ages 30 and 34 in the United States with a correlation coefficient (R) of -0.102 and weighted average of 84.7%. Similarly, the statistical analysis conducted on geographies consisting of 576,253,413 people shows no correlation between the proportion of Immigrants and labor force participation rate among population between the ages 30 and 34 in the United States with a correlation coefficient (R) of -0.023 and weighted average of 84.1%, a difference of 0.70%.
In Labor Force | Age 30-34 Correlation Summary
| Measurement | Immigrants from Burma/Myanmar | Immigrants |
| Minimum | 66.1% | 76.6% |
| Maximum | 100.0% | 89.0% |
| Range | 33.9% | 12.4% |
| Mean | 83.5% | 83.8% |
| Median | 84.4% | 84.1% |
| Interquartile 25% (IQ1) | 81.8% | 82.6% |
| Interquartile 75% (IQ3) | 86.7% | 85.0% |
| Interquartile Range (IQR) | 4.9% | 2.3% |
| Standard Deviation (Sample) | 6.9% | 2.0% |
| Standard Deviation (Population) | 6.9% | 2.0% |
Similar Demographics by In Labor Force | Age 30-34
Demographics Similar to Immigrants from Burma/Myanmar by In Labor Force | Age 30-34
In terms of in labor force | age 30-34, the demographic groups most similar to Immigrants from Burma/Myanmar are Immigrants from Peru (84.7%, a difference of 0.0%), South American Indian (84.7%, a difference of 0.0%), Irish (84.7%, a difference of 0.0%), Immigrants from England (84.7%, a difference of 0.0%), and Israeli (84.7%, a difference of 0.010%).
| Demographics | Rating | Rank | In Labor Force | Age 30-34 |
| Immigrants | Uruguay | 57.4 /100 | #163 | Average 84.7% |
| Icelanders | 56.8 /100 | #164 | Average 84.7% |
| Immigrants | Western Europe | 56.7 /100 | #165 | Average 84.7% |
| Afghans | 55.2 /100 | #166 | Average 84.7% |
| Immigrants | South Eastern Asia | 54.2 /100 | #167 | Average 84.7% |
| Immigrants | Peru | 52.4 /100 | #168 | Average 84.7% |
| South American Indians | 52.1 /100 | #169 | Average 84.7% |
| Immigrants | Burma/Myanmar | 52.0 /100 | #170 | Average 84.7% |
| Irish | 52.0 /100 | #171 | Average 84.7% |
| Immigrants | England | 51.7 /100 | #172 | Average 84.7% |
| Israelis | 51.1 /100 | #173 | Average 84.7% |
| Finns | 50.0 /100 | #174 | Average 84.7% |
| Immigrants | South America | 50.0 /100 | #175 | Average 84.7% |
| Immigrants | Uzbekistan | 49.1 /100 | #176 | Average 84.7% |
| Laotians | 46.9 /100 | #177 | Average 84.7% |
Demographics Similar to Immigrants by In Labor Force | Age 30-34
In terms of in labor force | age 30-34, the demographic groups most similar to Immigrants are West Indian (84.1%, a difference of 0.010%), Malaysian (84.1%, a difference of 0.020%), Haitian (84.1%, a difference of 0.020%), French American Indian (84.1%, a difference of 0.030%), and Immigrants from Bahamas (84.1%, a difference of 0.050%).
| Demographics | Rating | Rank | In Labor Force | Age 30-34 |
| Scottish | 3.1 /100 | #225 | Tragic 84.2% |
| Immigrants | El Salvador | 3.0 /100 | #226 | Tragic 84.2% |
| Immigrants | Cuba | 3.0 /100 | #227 | Tragic 84.2% |
| Immigrants | Haiti | 2.8 /100 | #228 | Tragic 84.2% |
| Welsh | 2.7 /100 | #229 | Tragic 84.2% |
| Immigrants | Bahamas | 2.6 /100 | #230 | Tragic 84.1% |
| Malaysians | 2.2 /100 | #231 | Tragic 84.1% |
| Immigrants | Immigrants | 2.0 /100 | #232 | Tragic 84.1% |
| West Indians | 1.9 /100 | #233 | Tragic 84.1% |
| Haitians | 1.8 /100 | #234 | Tragic 84.1% |
| French American Indians | 1.7 /100 | #235 | Tragic 84.1% |
| U.S. Virgin Islanders | 1.5 /100 | #236 | Tragic 84.1% |
| Celtics | 1.4 /100 | #237 | Tragic 84.1% |
| Immigrants | Barbados | 1.4 /100 | #238 | Tragic 84.0% |
| English | 1.4 /100 | #239 | Tragic 84.0% |