Immigrants from Burma/Myanmar vs Immigrants In Labor Force | Age 20-64
COMPARE
Immigrants from Burma/Myanmar
Immigrants
In Labor Force | Age 20-64
In Labor Force | Age 20-64 Comparison
Immigrants from Burma/Myanmar
Immigrants
79.7%
IN LABOR FORCE | AGE 20-64
64.4/ 100
METRIC RATING
164th/ 347
METRIC RANK
79.2%
IN LABOR FORCE | AGE 20-64
7.7/ 100
METRIC RATING
220th/ 347
METRIC RANK
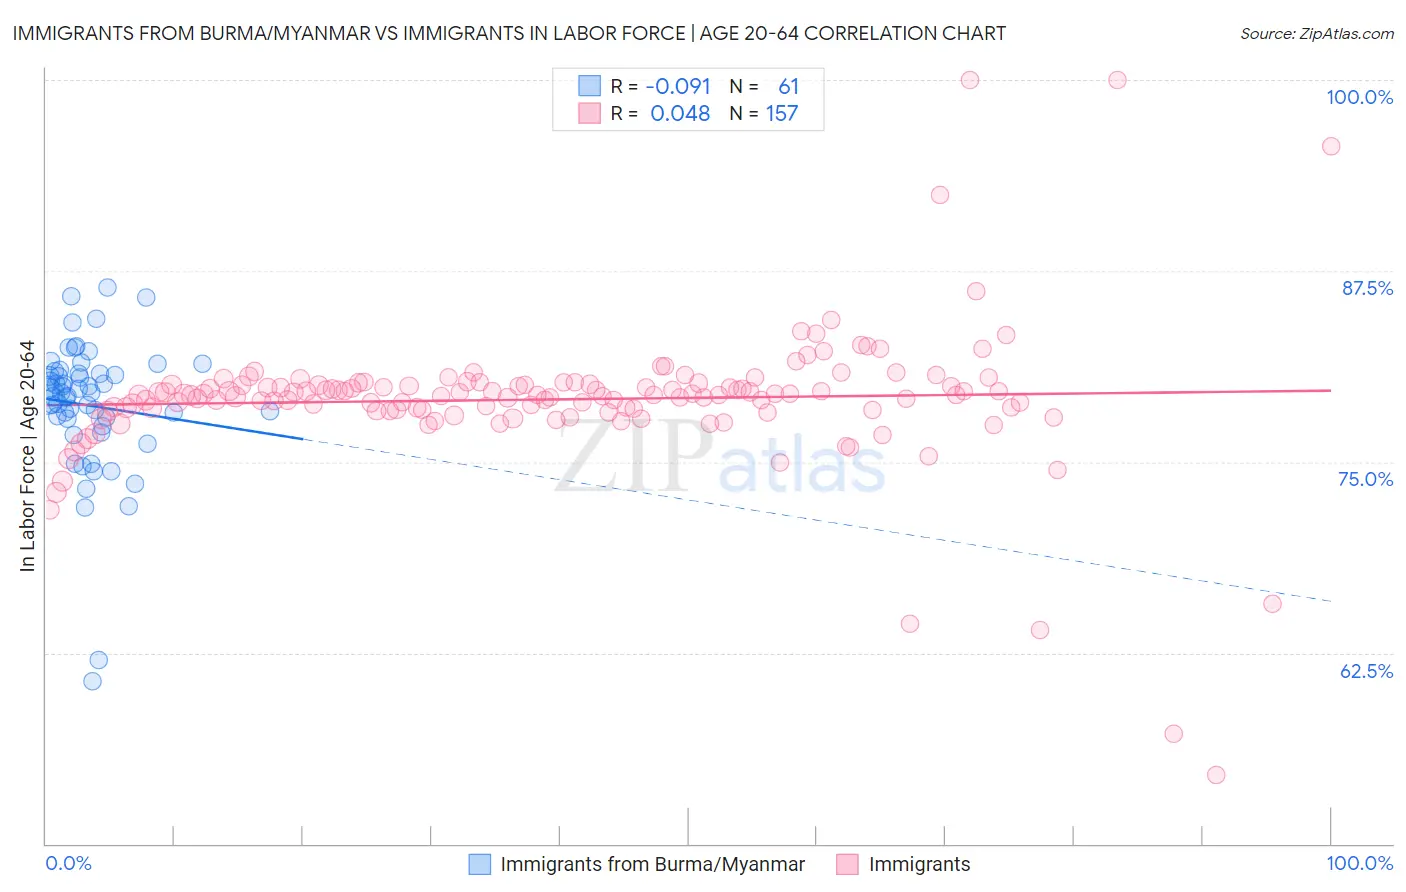
Immigrants from Burma/Myanmar vs Immigrants In Labor Force | Age 20-64 Correlation Chart
The statistical analysis conducted on geographies consisting of 172,360,396 people shows a slight negative correlation between the proportion of Immigrants from Burma/Myanmar and labor force participation rate among population between the ages 20 and 64 in the United States with a correlation coefficient (R) of -0.091 and weighted average of 79.7%. Similarly, the statistical analysis conducted on geographies consisting of 577,767,057 people shows no correlation between the proportion of Immigrants and labor force participation rate among population between the ages 20 and 64 in the United States with a correlation coefficient (R) of 0.048 and weighted average of 79.2%, a difference of 0.62%.
In Labor Force | Age 20-64 Correlation Summary
| Measurement | Immigrants from Burma/Myanmar | Immigrants |
| Minimum | 60.6% | 54.5% |
| Maximum | 86.4% | 100.0% |
| Range | 25.8% | 45.5% |
| Mean | 78.7% | 79.1% |
| Median | 79.5% | 79.4% |
| Interquartile 25% (IQ1) | 77.6% | 78.4% |
| Interquartile 75% (IQ3) | 80.9% | 80.1% |
| Interquartile Range (IQR) | 3.3% | 1.7% |
| Standard Deviation (Sample) | 4.5% | 4.8% |
| Standard Deviation (Population) | 4.5% | 4.8% |
Similar Demographics by In Labor Force | Age 20-64
Demographics Similar to Immigrants from Burma/Myanmar by In Labor Force | Age 20-64
In terms of in labor force | age 20-64, the demographic groups most similar to Immigrants from Burma/Myanmar are Immigrants from Costa Rica (79.7%, a difference of 0.0%), Nigerian (79.7%, a difference of 0.0%), German (79.7%, a difference of 0.010%), Okinawan (79.6%, a difference of 0.010%), and Immigrants from Cuba (79.7%, a difference of 0.020%).
| Demographics | Rating | Rank | In Labor Force | Age 20-64 |
| Immigrants | China | 69.1 /100 | #157 | Good 79.7% |
| Austrians | 67.6 /100 | #158 | Good 79.7% |
| Immigrants | Cuba | 66.7 /100 | #159 | Good 79.7% |
| Moroccans | 66.7 /100 | #160 | Good 79.7% |
| South Africans | 66.2 /100 | #161 | Good 79.7% |
| Germans | 65.2 /100 | #162 | Good 79.7% |
| Immigrants | Costa Rica | 64.6 /100 | #163 | Good 79.7% |
| Immigrants | Burma/Myanmar | 64.4 /100 | #164 | Good 79.7% |
| Nigerians | 64.0 /100 | #165 | Good 79.7% |
| Okinawans | 62.7 /100 | #166 | Good 79.6% |
| Immigrants | Iraq | 62.0 /100 | #167 | Good 79.6% |
| Immigrants | Indonesia | 61.8 /100 | #168 | Good 79.6% |
| Laotians | 58.4 /100 | #169 | Average 79.6% |
| Slavs | 54.0 /100 | #170 | Average 79.6% |
| Immigrants | Switzerland | 53.3 /100 | #171 | Average 79.6% |
Demographics Similar to Immigrants by In Labor Force | Age 20-64
In terms of in labor force | age 20-64, the demographic groups most similar to Immigrants are Hungarian (79.2%, a difference of 0.010%), French Canadian (79.2%, a difference of 0.020%), Immigrants from Panama (79.1%, a difference of 0.030%), Canadian (79.1%, a difference of 0.030%), and Immigrants from Uzbekistan (79.1%, a difference of 0.030%).
| Demographics | Rating | Rank | In Labor Force | Age 20-64 |
| Immigrants | Portugal | 12.8 /100 | #213 | Poor 79.3% |
| Immigrants | Armenia | 12.2 /100 | #214 | Poor 79.2% |
| Immigrants | Norway | 12.0 /100 | #215 | Poor 79.2% |
| Arabs | 11.4 /100 | #216 | Poor 79.2% |
| Immigrants | Western Asia | 11.0 /100 | #217 | Poor 79.2% |
| Immigrants | England | 9.3 /100 | #218 | Tragic 79.2% |
| French Canadians | 8.4 /100 | #219 | Tragic 79.2% |
| Immigrants | Immigrants | 7.7 /100 | #220 | Tragic 79.2% |
| Hungarians | 7.2 /100 | #221 | Tragic 79.2% |
| Immigrants | Panama | 6.9 /100 | #222 | Tragic 79.1% |
| Canadians | 6.8 /100 | #223 | Tragic 79.1% |
| Immigrants | Uzbekistan | 6.8 /100 | #224 | Tragic 79.1% |
| Portuguese | 6.4 /100 | #225 | Tragic 79.1% |
| Central Americans | 5.9 /100 | #226 | Tragic 79.1% |
| Immigrants | Western Europe | 5.9 /100 | #227 | Tragic 79.1% |