Immigrants from Vietnam vs Immigrants from Ethiopia Single Mother Poverty
COMPARE
Immigrants from Vietnam
Immigrants from Ethiopia
Single Mother Poverty
Single Mother Poverty Comparison
Immigrants from Vietnam
Immigrants from Ethiopia
26.7%
SINGLE MOTHER POVERTY
99.9/ 100
METRIC RATING
40th/ 347
METRIC RANK
27.7%
SINGLE MOTHER POVERTY
98.4/ 100
METRIC RATING
89th/ 347
METRIC RANK
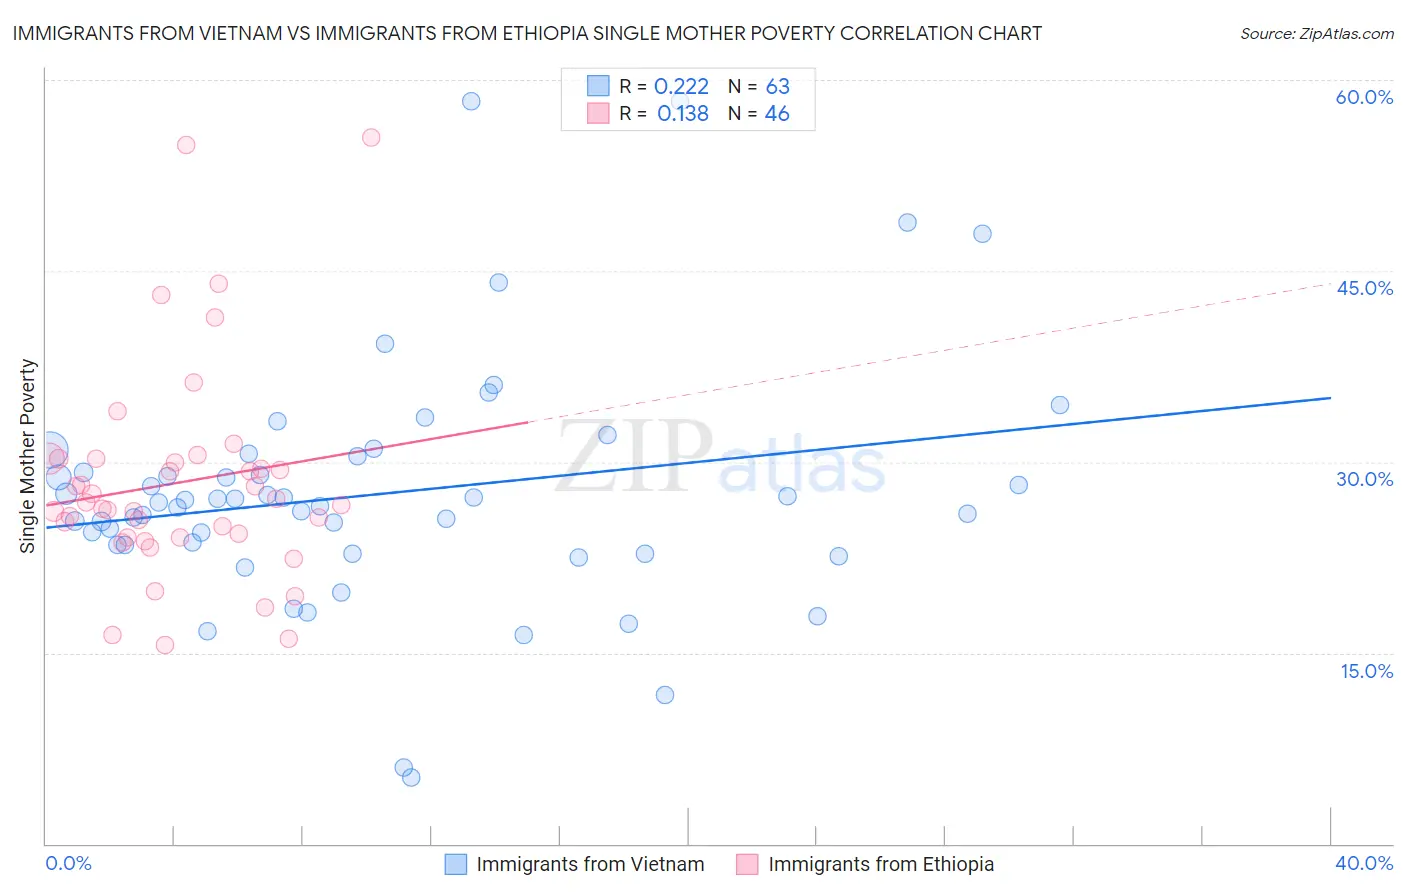
Immigrants from Vietnam vs Immigrants from Ethiopia Single Mother Poverty Correlation Chart
The statistical analysis conducted on geographies consisting of 395,889,190 people shows a weak positive correlation between the proportion of Immigrants from Vietnam and poverty level among single mothers in the United States with a correlation coefficient (R) of 0.222 and weighted average of 26.7%. Similarly, the statistical analysis conducted on geographies consisting of 209,365,382 people shows a poor positive correlation between the proportion of Immigrants from Ethiopia and poverty level among single mothers in the United States with a correlation coefficient (R) of 0.138 and weighted average of 27.7%, a difference of 3.8%.
Single Mother Poverty Correlation Summary
| Measurement | Immigrants from Vietnam | Immigrants from Ethiopia |
| Minimum | 5.2% | 15.6% |
| Maximum | 58.3% | 55.4% |
| Range | 53.1% | 39.9% |
| Mean | 27.5% | 28.4% |
| Median | 26.8% | 26.7% |
| Interquartile 25% (IQ1) | 23.5% | 24.1% |
| Interquartile 75% (IQ3) | 30.5% | 30.2% |
| Interquartile Range (IQR) | 7.0% | 6.1% |
| Standard Deviation (Sample) | 9.5% | 8.3% |
| Standard Deviation (Population) | 9.4% | 8.2% |
Similar Demographics by Single Mother Poverty
Demographics Similar to Immigrants from Vietnam by Single Mother Poverty
In terms of single mother poverty, the demographic groups most similar to Immigrants from Vietnam are Immigrants from Greece (26.7%, a difference of 0.070%), Sri Lankan (26.7%, a difference of 0.090%), Armenian (26.8%, a difference of 0.31%), Tsimshian (26.8%, a difference of 0.39%), and Immigrants from Fiji (26.6%, a difference of 0.43%).
| Demographics | Rating | Rank | Single Mother Poverty |
| Bulgarians | 99.9 /100 | #33 | Exceptional 26.5% |
| Immigrants | Indonesia | 99.9 /100 | #34 | Exceptional 26.6% |
| Maltese | 99.9 /100 | #35 | Exceptional 26.6% |
| Okinawans | 99.9 /100 | #36 | Exceptional 26.6% |
| Immigrants | Israel | 99.9 /100 | #37 | Exceptional 26.6% |
| Immigrants | Fiji | 99.9 /100 | #38 | Exceptional 26.6% |
| Sri Lankans | 99.9 /100 | #39 | Exceptional 26.7% |
| Immigrants | Vietnam | 99.9 /100 | #40 | Exceptional 26.7% |
| Immigrants | Greece | 99.9 /100 | #41 | Exceptional 26.7% |
| Armenians | 99.9 /100 | #42 | Exceptional 26.8% |
| Tsimshian | 99.9 /100 | #43 | Exceptional 26.8% |
| Immigrants | Sierra Leone | 99.9 /100 | #44 | Exceptional 26.9% |
| Latvians | 99.9 /100 | #45 | Exceptional 26.9% |
| Immigrants | Serbia | 99.9 /100 | #46 | Exceptional 26.9% |
| Egyptians | 99.8 /100 | #47 | Exceptional 26.9% |
Demographics Similar to Immigrants from Ethiopia by Single Mother Poverty
In terms of single mother poverty, the demographic groups most similar to Immigrants from Ethiopia are Ethiopian (27.7%, a difference of 0.020%), Afghan (27.7%, a difference of 0.040%), Immigrants from Ukraine (27.7%, a difference of 0.14%), Immigrants from France (27.8%, a difference of 0.18%), and Immigrants from Latvia (27.7%, a difference of 0.23%).
| Demographics | Rating | Rank | Single Mother Poverty |
| Immigrants | Cameroon | 98.8 /100 | #82 | Exceptional 27.6% |
| Greeks | 98.7 /100 | #83 | Exceptional 27.7% |
| Immigrants | Latvia | 98.7 /100 | #84 | Exceptional 27.7% |
| Mongolians | 98.7 /100 | #85 | Exceptional 27.7% |
| Immigrants | Ukraine | 98.6 /100 | #86 | Exceptional 27.7% |
| Afghans | 98.5 /100 | #87 | Exceptional 27.7% |
| Ethiopians | 98.4 /100 | #88 | Exceptional 27.7% |
| Immigrants | Ethiopia | 98.4 /100 | #89 | Exceptional 27.7% |
| Immigrants | France | 98.2 /100 | #90 | Exceptional 27.8% |
| Immigrants | Albania | 98.0 /100 | #91 | Exceptional 27.8% |
| Estonians | 97.9 /100 | #92 | Exceptional 27.8% |
| Romanians | 97.8 /100 | #93 | Exceptional 27.8% |
| Albanians | 97.6 /100 | #94 | Exceptional 27.9% |
| Chileans | 97.5 /100 | #95 | Exceptional 27.9% |
| Immigrants | Iraq | 97.3 /100 | #96 | Exceptional 27.9% |