Immigrants from Albania vs Immigrants from Ethiopia Single Mother Poverty
COMPARE
Immigrants from Albania
Immigrants from Ethiopia
Single Mother Poverty
Single Mother Poverty Comparison
Immigrants from Albania
Immigrants from Ethiopia
27.8%
SINGLE MOTHER POVERTY
98.0/ 100
METRIC RATING
91st/ 347
METRIC RANK
27.7%
SINGLE MOTHER POVERTY
98.4/ 100
METRIC RATING
89th/ 347
METRIC RANK
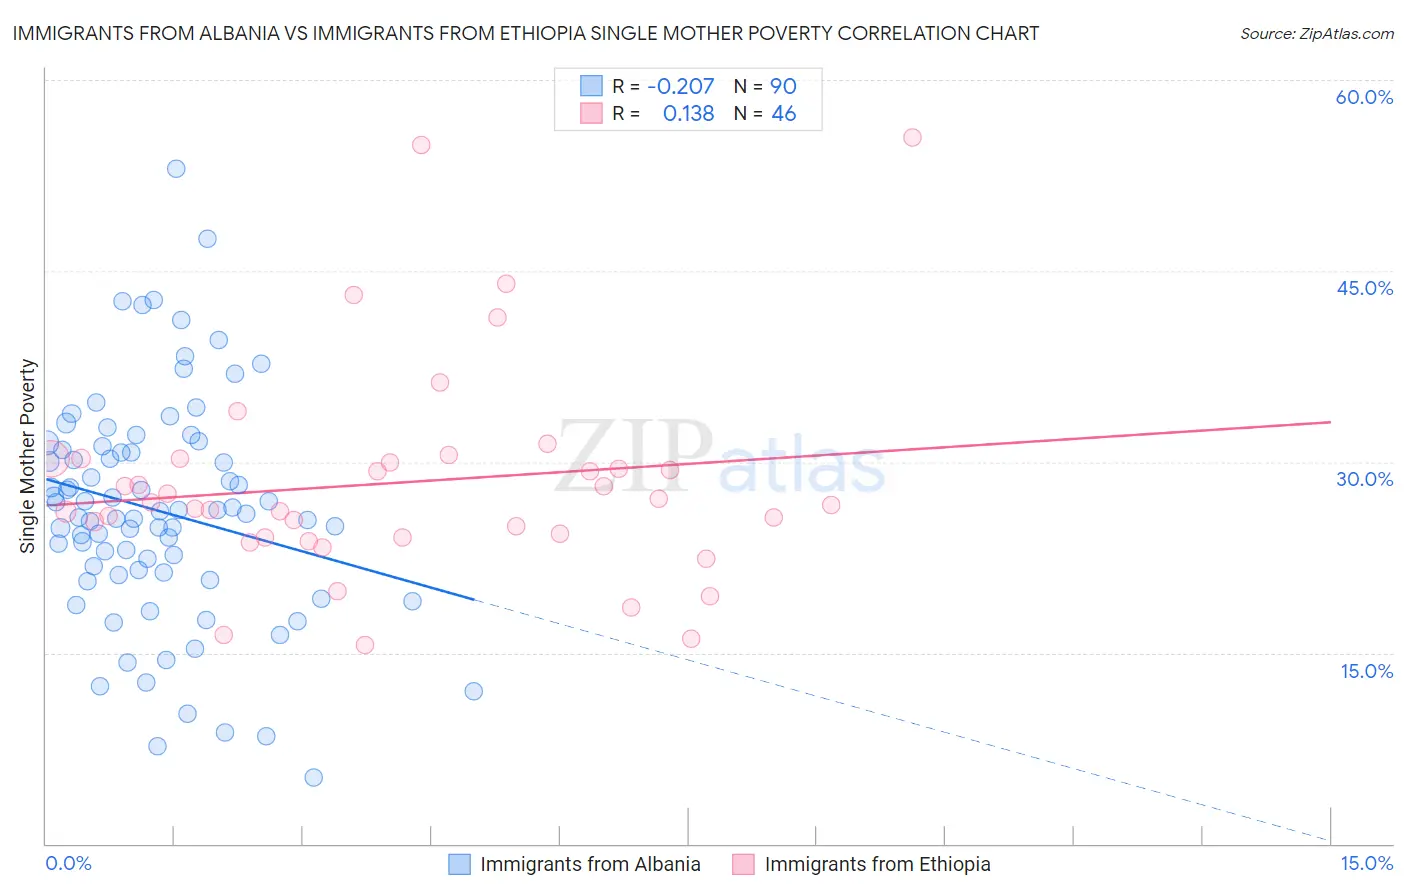
Immigrants from Albania vs Immigrants from Ethiopia Single Mother Poverty Correlation Chart
The statistical analysis conducted on geographies consisting of 117,790,749 people shows a weak negative correlation between the proportion of Immigrants from Albania and poverty level among single mothers in the United States with a correlation coefficient (R) of -0.207 and weighted average of 27.8%. Similarly, the statistical analysis conducted on geographies consisting of 209,365,382 people shows a poor positive correlation between the proportion of Immigrants from Ethiopia and poverty level among single mothers in the United States with a correlation coefficient (R) of 0.138 and weighted average of 27.7%, a difference of 0.32%.
Single Mother Poverty Correlation Summary
| Measurement | Immigrants from Albania | Immigrants from Ethiopia |
| Minimum | 5.2% | 15.6% |
| Maximum | 53.0% | 55.4% |
| Range | 47.8% | 39.9% |
| Mean | 26.1% | 28.4% |
| Median | 26.0% | 26.7% |
| Interquartile 25% (IQ1) | 21.3% | 24.1% |
| Interquartile 75% (IQ3) | 31.0% | 30.2% |
| Interquartile Range (IQR) | 9.7% | 6.1% |
| Standard Deviation (Sample) | 8.8% | 8.3% |
| Standard Deviation (Population) | 8.8% | 8.2% |
Demographics Similar to Immigrants from Albania and Immigrants from Ethiopia by Single Mother Poverty
In terms of single mother poverty, the demographic groups most similar to Immigrants from Albania are Estonian (27.8%, a difference of 0.030%), Romanian (27.8%, a difference of 0.12%), Immigrants from France (27.8%, a difference of 0.14%), Albanian (27.9%, a difference of 0.22%), and Chilean (27.9%, a difference of 0.25%). Similarly, the demographic groups most similar to Immigrants from Ethiopia are Ethiopian (27.7%, a difference of 0.020%), Afghan (27.7%, a difference of 0.040%), Immigrants from Ukraine (27.7%, a difference of 0.14%), Immigrants from France (27.8%, a difference of 0.18%), and Immigrants from Latvia (27.7%, a difference of 0.23%).
| Demographics | Rating | Rank | Single Mother Poverty |
| Taiwanese | 99.1 /100 | #80 | Exceptional 27.5% |
| Immigrants | Scotland | 98.9 /100 | #81 | Exceptional 27.6% |
| Immigrants | Cameroon | 98.8 /100 | #82 | Exceptional 27.6% |
| Greeks | 98.7 /100 | #83 | Exceptional 27.7% |
| Immigrants | Latvia | 98.7 /100 | #84 | Exceptional 27.7% |
| Mongolians | 98.7 /100 | #85 | Exceptional 27.7% |
| Immigrants | Ukraine | 98.6 /100 | #86 | Exceptional 27.7% |
| Afghans | 98.5 /100 | #87 | Exceptional 27.7% |
| Ethiopians | 98.4 /100 | #88 | Exceptional 27.7% |
| Immigrants | Ethiopia | 98.4 /100 | #89 | Exceptional 27.7% |
| Immigrants | France | 98.2 /100 | #90 | Exceptional 27.8% |
| Immigrants | Albania | 98.0 /100 | #91 | Exceptional 27.8% |
| Estonians | 97.9 /100 | #92 | Exceptional 27.8% |
| Romanians | 97.8 /100 | #93 | Exceptional 27.8% |
| Albanians | 97.6 /100 | #94 | Exceptional 27.9% |
| Chileans | 97.5 /100 | #95 | Exceptional 27.9% |
| Immigrants | Iraq | 97.3 /100 | #96 | Exceptional 27.9% |
| Immigrants | Brazil | 97.2 /100 | #97 | Exceptional 27.9% |
| Immigrants | Nepal | 97.2 /100 | #98 | Exceptional 27.9% |
| Immigrants | Netherlands | 97.2 /100 | #99 | Exceptional 27.9% |
| Zimbabweans | 97.1 /100 | #100 | Exceptional 27.9% |