Guamanian/Chamorro vs Immigrants from Caribbean Poverty
COMPARE
Guamanian/Chamorro
Immigrants from Caribbean
Poverty
Poverty Comparison
Guamanians/Chamorros
Immigrants from Caribbean
12.1%
POVERTY
63.9/ 100
METRIC RATING
154th/ 347
METRIC RANK
15.5%
POVERTY
0.0/ 100
METRIC RATING
303rd/ 347
METRIC RANK
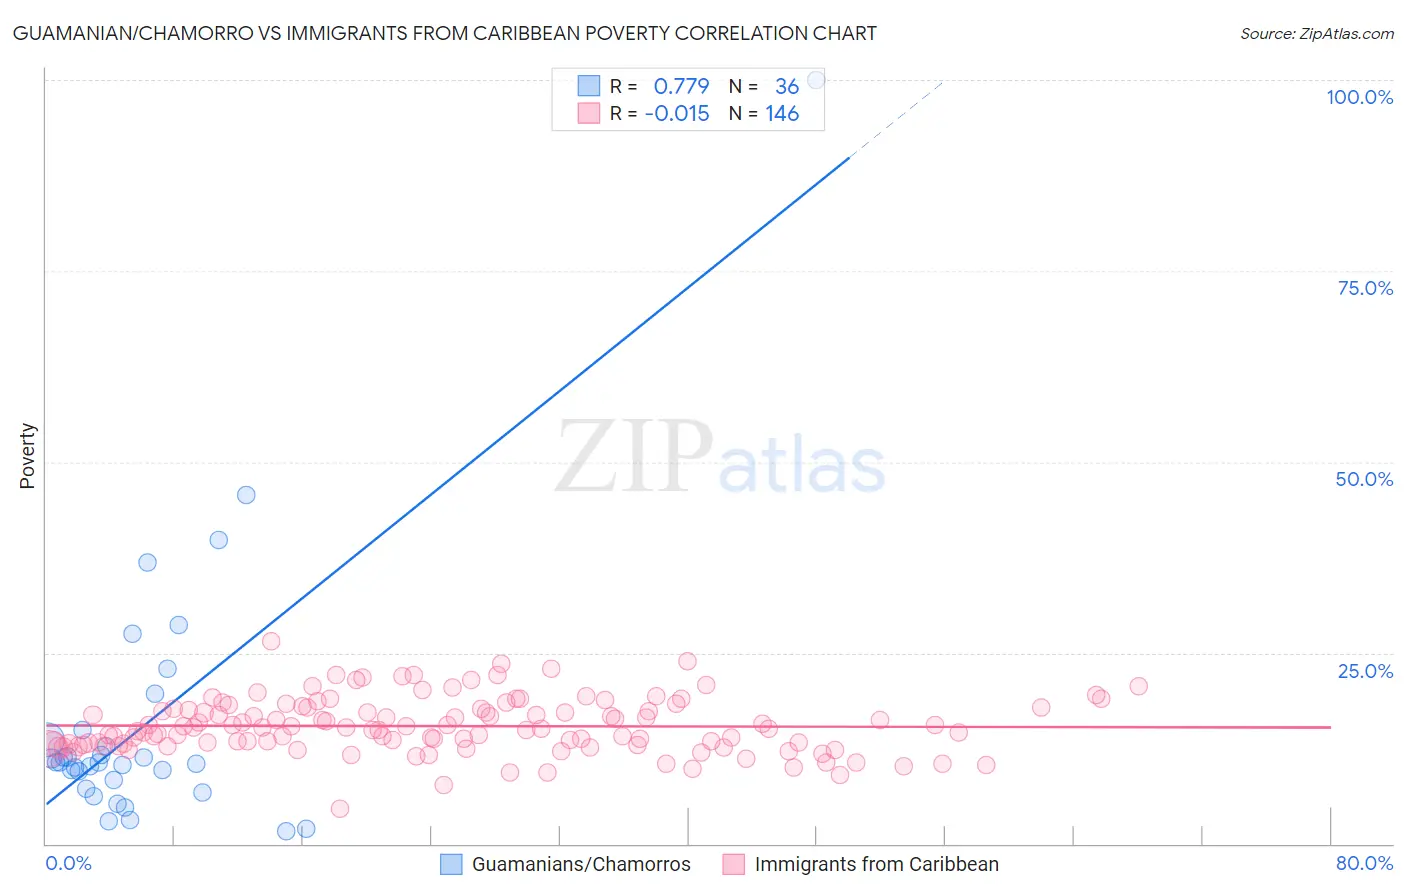
Guamanian/Chamorro vs Immigrants from Caribbean Poverty Correlation Chart
The statistical analysis conducted on geographies consisting of 221,867,885 people shows a strong positive correlation between the proportion of Guamanians/Chamorros and poverty level in the United States with a correlation coefficient (R) of 0.779 and weighted average of 12.1%. Similarly, the statistical analysis conducted on geographies consisting of 449,609,031 people shows no correlation between the proportion of Immigrants from Caribbean and poverty level in the United States with a correlation coefficient (R) of -0.015 and weighted average of 15.5%, a difference of 27.5%.
Poverty Correlation Summary
| Measurement | Guamanian/Chamorro | Immigrants from Caribbean |
| Minimum | 1.7% | 4.5% |
| Maximum | 100.0% | 26.5% |
| Range | 98.3% | 22.0% |
| Mean | 15.8% | 15.4% |
| Median | 10.7% | 15.0% |
| Interquartile 25% (IQ1) | 7.8% | 13.0% |
| Interquartile 75% (IQ3) | 14.3% | 17.7% |
| Interquartile Range (IQR) | 6.5% | 4.8% |
| Standard Deviation (Sample) | 17.8% | 3.6% |
| Standard Deviation (Population) | 17.5% | 3.6% |
Similar Demographics by Poverty
Demographics Similar to Guamanians/Chamorros by Poverty
In terms of poverty, the demographic groups most similar to Guamanians/Chamorros are Immigrants from Northern Africa (12.1%, a difference of 0.010%), Hungarian (12.2%, a difference of 0.020%), Scotch-Irish (12.2%, a difference of 0.14%), Costa Rican (12.2%, a difference of 0.18%), and Taiwanese (12.2%, a difference of 0.22%).
| Demographics | Rating | Rank | Poverty |
| Immigrants | Bosnia and Herzegovina | 73.7 /100 | #147 | Good 12.0% |
| Immigrants | Germany | 72.7 /100 | #148 | Good 12.0% |
| Immigrants | Malaysia | 72.7 /100 | #149 | Good 12.0% |
| Immigrants | Kazakhstan | 72.3 /100 | #150 | Good 12.0% |
| Samoans | 71.9 /100 | #151 | Good 12.0% |
| Armenians | 67.6 /100 | #152 | Good 12.1% |
| Immigrants | Northern Africa | 63.9 /100 | #153 | Good 12.1% |
| Guamanians/Chamorros | 63.9 /100 | #154 | Good 12.1% |
| Hungarians | 63.6 /100 | #155 | Good 12.2% |
| Scotch-Irish | 62.6 /100 | #156 | Good 12.2% |
| Costa Ricans | 62.2 /100 | #157 | Good 12.2% |
| Taiwanese | 61.8 /100 | #158 | Good 12.2% |
| Pennsylvania Germans | 60.8 /100 | #159 | Good 12.2% |
| Immigrants | Nepal | 60.4 /100 | #160 | Good 12.2% |
| Immigrants | Fiji | 59.1 /100 | #161 | Average 12.2% |
Demographics Similar to Immigrants from Caribbean by Poverty
In terms of poverty, the demographic groups most similar to Immigrants from Caribbean are Immigrants from Mexico (15.5%, a difference of 0.090%), Immigrants from Guatemala (15.5%, a difference of 0.12%), Somali (15.4%, a difference of 0.48%), Creek (15.6%, a difference of 0.56%), and Bahamian (15.4%, a difference of 0.61%).
| Demographics | Rating | Rank | Poverty |
| Hispanics or Latinos | 0.0 /100 | #296 | Tragic 15.3% |
| Immigrants | Bangladesh | 0.0 /100 | #297 | Tragic 15.3% |
| Immigrants | Senegal | 0.0 /100 | #298 | Tragic 15.3% |
| Senegalese | 0.0 /100 | #299 | Tragic 15.3% |
| Immigrants | Central America | 0.0 /100 | #300 | Tragic 15.4% |
| Bahamians | 0.0 /100 | #301 | Tragic 15.4% |
| Somalis | 0.0 /100 | #302 | Tragic 15.4% |
| Immigrants | Caribbean | 0.0 /100 | #303 | Tragic 15.5% |
| Immigrants | Mexico | 0.0 /100 | #304 | Tragic 15.5% |
| Immigrants | Guatemala | 0.0 /100 | #305 | Tragic 15.5% |
| Creek | 0.0 /100 | #306 | Tragic 15.6% |
| Africans | 0.0 /100 | #307 | Tragic 15.6% |
| Choctaw | 0.0 /100 | #308 | Tragic 15.6% |
| Seminole | 0.0 /100 | #309 | Tragic 15.6% |
| Dutch West Indians | 0.0 /100 | #310 | Tragic 15.6% |