Egyptian vs Immigrants from Caribbean Poverty
COMPARE
Egyptian
Immigrants from Caribbean
Poverty
Poverty Comparison
Egyptians
Immigrants from Caribbean
11.3%
POVERTY
96.5/ 100
METRIC RATING
82nd/ 347
METRIC RANK
15.5%
POVERTY
0.0/ 100
METRIC RATING
303rd/ 347
METRIC RANK
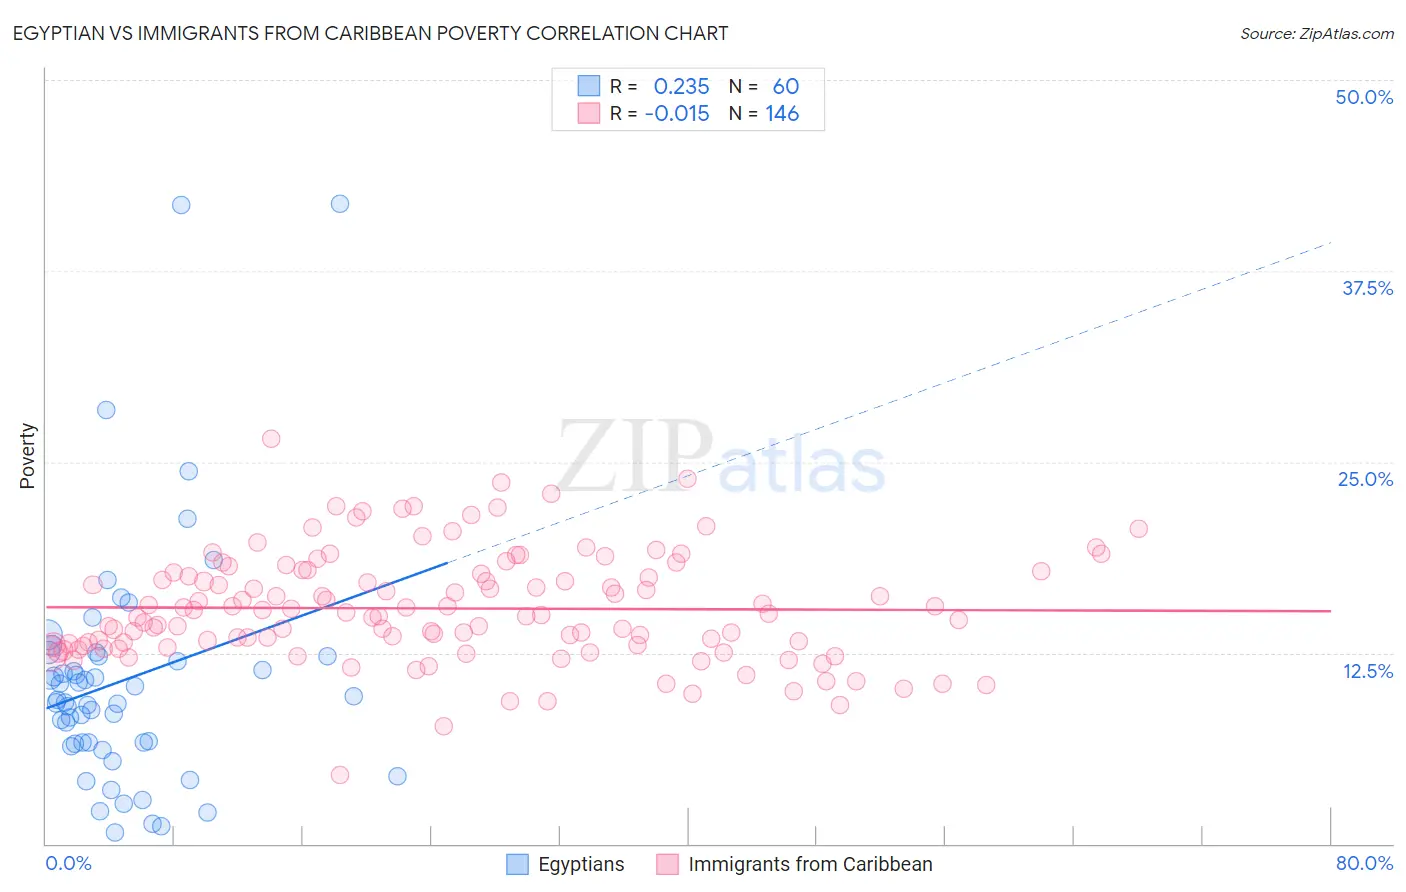
Egyptian vs Immigrants from Caribbean Poverty Correlation Chart
The statistical analysis conducted on geographies consisting of 276,768,779 people shows a weak positive correlation between the proportion of Egyptians and poverty level in the United States with a correlation coefficient (R) of 0.235 and weighted average of 11.3%. Similarly, the statistical analysis conducted on geographies consisting of 449,609,031 people shows no correlation between the proportion of Immigrants from Caribbean and poverty level in the United States with a correlation coefficient (R) of -0.015 and weighted average of 15.5%, a difference of 36.7%.
Poverty Correlation Summary
| Measurement | Egyptian | Immigrants from Caribbean |
| Minimum | 0.75% | 4.5% |
| Maximum | 41.9% | 26.5% |
| Range | 41.2% | 22.0% |
| Mean | 10.7% | 15.4% |
| Median | 9.3% | 15.0% |
| Interquartile 25% (IQ1) | 6.6% | 13.0% |
| Interquartile 75% (IQ3) | 12.3% | 17.7% |
| Interquartile Range (IQR) | 5.7% | 4.8% |
| Standard Deviation (Sample) | 7.9% | 3.6% |
| Standard Deviation (Population) | 7.8% | 3.6% |
Similar Demographics by Poverty
Demographics Similar to Egyptians by Poverty
In terms of poverty, the demographic groups most similar to Egyptians are Irish (11.3%, a difference of 0.090%), Indian (Asian) (11.3%, a difference of 0.10%), Cambodian (11.3%, a difference of 0.12%), Dutch (11.3%, a difference of 0.16%), and Immigrants from Eastern Asia (11.3%, a difference of 0.18%).
| Demographics | Rating | Rank | Poverty |
| Immigrants | Eastern Europe | 97.0 /100 | #75 | Exceptional 11.3% |
| Immigrants | North America | 96.8 /100 | #76 | Exceptional 11.3% |
| Immigrants | Eastern Asia | 96.7 /100 | #77 | Exceptional 11.3% |
| Dutch | 96.7 /100 | #78 | Exceptional 11.3% |
| Cambodians | 96.7 /100 | #79 | Exceptional 11.3% |
| Indians (Asian) | 96.6 /100 | #80 | Exceptional 11.3% |
| Irish | 96.6 /100 | #81 | Exceptional 11.3% |
| Egyptians | 96.5 /100 | #82 | Exceptional 11.3% |
| Immigrants | Sweden | 96.3 /100 | #83 | Exceptional 11.3% |
| English | 96.3 /100 | #84 | Exceptional 11.3% |
| Immigrants | England | 96.2 /100 | #85 | Exceptional 11.4% |
| Jordanians | 96.0 /100 | #86 | Exceptional 11.4% |
| Northern Europeans | 96.0 /100 | #87 | Exceptional 11.4% |
| Belgians | 95.8 /100 | #88 | Exceptional 11.4% |
| Czechoslovakians | 95.7 /100 | #89 | Exceptional 11.4% |
Demographics Similar to Immigrants from Caribbean by Poverty
In terms of poverty, the demographic groups most similar to Immigrants from Caribbean are Immigrants from Mexico (15.5%, a difference of 0.090%), Immigrants from Guatemala (15.5%, a difference of 0.12%), Somali (15.4%, a difference of 0.48%), Creek (15.6%, a difference of 0.56%), and Bahamian (15.4%, a difference of 0.61%).
| Demographics | Rating | Rank | Poverty |
| Hispanics or Latinos | 0.0 /100 | #296 | Tragic 15.3% |
| Immigrants | Bangladesh | 0.0 /100 | #297 | Tragic 15.3% |
| Immigrants | Senegal | 0.0 /100 | #298 | Tragic 15.3% |
| Senegalese | 0.0 /100 | #299 | Tragic 15.3% |
| Immigrants | Central America | 0.0 /100 | #300 | Tragic 15.4% |
| Bahamians | 0.0 /100 | #301 | Tragic 15.4% |
| Somalis | 0.0 /100 | #302 | Tragic 15.4% |
| Immigrants | Caribbean | 0.0 /100 | #303 | Tragic 15.5% |
| Immigrants | Mexico | 0.0 /100 | #304 | Tragic 15.5% |
| Immigrants | Guatemala | 0.0 /100 | #305 | Tragic 15.5% |
| Creek | 0.0 /100 | #306 | Tragic 15.6% |
| Africans | 0.0 /100 | #307 | Tragic 15.6% |
| Choctaw | 0.0 /100 | #308 | Tragic 15.6% |
| Seminole | 0.0 /100 | #309 | Tragic 15.6% |
| Dutch West Indians | 0.0 /100 | #310 | Tragic 15.6% |