Immigrants from Bulgaria vs Hispanic or Latino Unemployment
COMPARE
Immigrants from Bulgaria
Hispanic or Latino
Unemployment
Unemployment Comparison
Immigrants from Bulgaria
Hispanics or Latinos
4.9%
UNEMPLOYMENT
98.9/ 100
METRIC RATING
63rd/ 347
METRIC RANK
5.9%
UNEMPLOYMENT
0.0/ 100
METRIC RATING
272nd/ 347
METRIC RANK
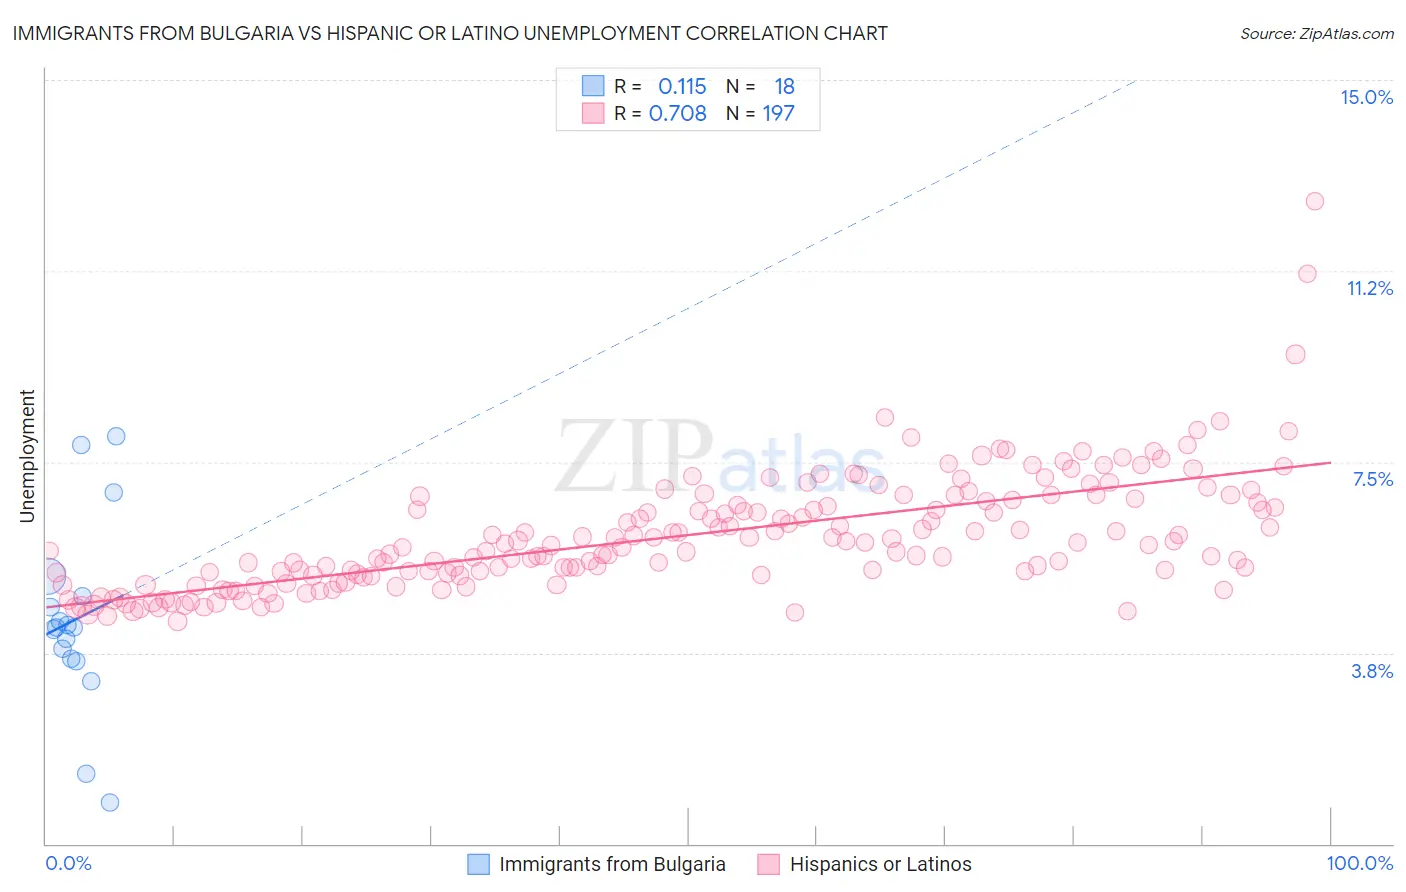
Immigrants from Bulgaria vs Hispanic or Latino Unemployment Correlation Chart
The statistical analysis conducted on geographies consisting of 172,511,279 people shows a poor positive correlation between the proportion of Immigrants from Bulgaria and unemployment in the United States with a correlation coefficient (R) of 0.115 and weighted average of 4.9%. Similarly, the statistical analysis conducted on geographies consisting of 570,210,949 people shows a strong positive correlation between the proportion of Hispanics or Latinos and unemployment in the United States with a correlation coefficient (R) of 0.708 and weighted average of 5.9%, a difference of 20.6%.
Unemployment Correlation Summary
| Measurement | Immigrants from Bulgaria | Hispanic or Latino |
| Minimum | 0.80% | 4.4% |
| Maximum | 8.0% | 12.6% |
| Range | 7.2% | 8.3% |
| Mean | 4.4% | 6.0% |
| Median | 4.2% | 5.9% |
| Interquartile 25% (IQ1) | 3.6% | 5.3% |
| Interquartile 75% (IQ3) | 4.9% | 6.7% |
| Interquartile Range (IQR) | 1.2% | 1.4% |
| Standard Deviation (Sample) | 1.8% | 1.1% |
| Standard Deviation (Population) | 1.8% | 1.1% |
Similar Demographics by Unemployment
Demographics Similar to Immigrants from Bulgaria by Unemployment
In terms of unemployment, the demographic groups most similar to Immigrants from Bulgaria are Icelander (4.9%, a difference of 0.010%), Immigrants from Netherlands (4.9%, a difference of 0.030%), Cambodian (4.9%, a difference of 0.030%), Bhutanese (4.9%, a difference of 0.070%), and Italian (4.9%, a difference of 0.080%).
| Demographics | Rating | Rank | Unemployment |
| Celtics | 99.1 /100 | #56 | Exceptional 4.9% |
| Immigrants | Singapore | 99.1 /100 | #57 | Exceptional 4.9% |
| Greeks | 99.0 /100 | #58 | Exceptional 4.9% |
| Bhutanese | 99.0 /100 | #59 | Exceptional 4.9% |
| Immigrants | Netherlands | 99.0 /100 | #60 | Exceptional 4.9% |
| Cambodians | 99.0 /100 | #61 | Exceptional 4.9% |
| Icelanders | 98.9 /100 | #62 | Exceptional 4.9% |
| Immigrants | Bulgaria | 98.9 /100 | #63 | Exceptional 4.9% |
| Italians | 98.9 /100 | #64 | Exceptional 4.9% |
| Immigrants | Canada | 98.8 /100 | #65 | Exceptional 4.9% |
| Slovaks | 98.7 /100 | #66 | Exceptional 4.9% |
| New Zealanders | 98.6 /100 | #67 | Exceptional 4.9% |
| Slavs | 98.6 /100 | #68 | Exceptional 4.9% |
| Immigrants | North America | 98.5 /100 | #69 | Exceptional 4.9% |
| Serbians | 98.4 /100 | #70 | Exceptional 4.9% |
Demographics Similar to Hispanics or Latinos by Unemployment
In terms of unemployment, the demographic groups most similar to Hispanics or Latinos are Immigrants from Fiji (5.9%, a difference of 0.17%), Bahamian (5.9%, a difference of 0.46%), Immigrants from Latin America (5.9%, a difference of 0.67%), Mexican (5.9%, a difference of 0.68%), and Blackfeet (5.8%, a difference of 0.92%).
| Demographics | Rating | Rank | Unemployment |
| Nigerians | 0.1 /100 | #265 | Tragic 5.8% |
| Mexican American Indians | 0.1 /100 | #266 | Tragic 5.8% |
| Immigrants | Nigeria | 0.1 /100 | #267 | Tragic 5.8% |
| Immigrants | Sierra Leone | 0.1 /100 | #268 | Tragic 5.8% |
| Immigrants | El Salvador | 0.1 /100 | #269 | Tragic 5.8% |
| Blackfeet | 0.1 /100 | #270 | Tragic 5.8% |
| Mexicans | 0.1 /100 | #271 | Tragic 5.9% |
| Hispanics or Latinos | 0.0 /100 | #272 | Tragic 5.9% |
| Immigrants | Fiji | 0.0 /100 | #273 | Tragic 5.9% |
| Bahamians | 0.0 /100 | #274 | Tragic 5.9% |
| Immigrants | Latin America | 0.0 /100 | #275 | Tragic 5.9% |
| Immigrants | Central America | 0.0 /100 | #276 | Tragic 6.0% |
| Armenians | 0.0 /100 | #277 | Tragic 6.0% |
| Ghanaians | 0.0 /100 | #278 | Tragic 6.0% |
| Immigrants | Mexico | 0.0 /100 | #279 | Tragic 6.0% |