Immigrants from Bulgaria vs Hispanic or Latino In Labor Force | Age 20-24
COMPARE
Immigrants from Bulgaria
Hispanic or Latino
In Labor Force | Age 20-24
In Labor Force | Age 20-24 Comparison
Immigrants from Bulgaria
Hispanics or Latinos
75.8%
IN LABOR FORCE | AGE 20-24
94.1/ 100
METRIC RATING
123rd/ 347
METRIC RANK
74.4%
IN LABOR FORCE | AGE 20-24
7.9/ 100
METRIC RATING
223rd/ 347
METRIC RANK
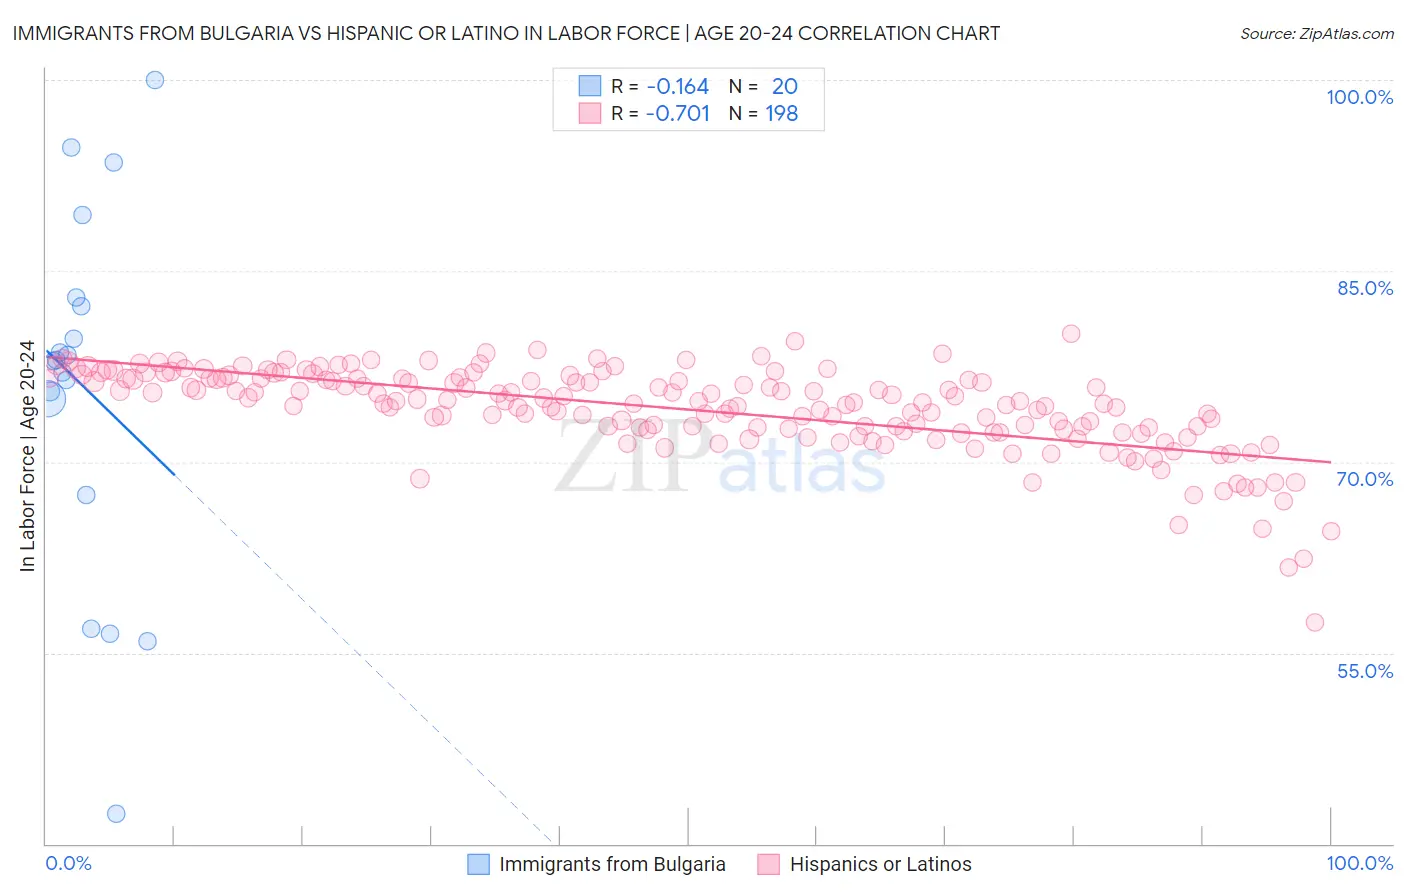
Immigrants from Bulgaria vs Hispanic or Latino In Labor Force | Age 20-24 Correlation Chart
The statistical analysis conducted on geographies consisting of 172,510,065 people shows a poor negative correlation between the proportion of Immigrants from Bulgaria and labor force participation rate among population between the ages 20 and 24 in the United States with a correlation coefficient (R) of -0.164 and weighted average of 75.8%. Similarly, the statistical analysis conducted on geographies consisting of 573,599,041 people shows a strong negative correlation between the proportion of Hispanics or Latinos and labor force participation rate among population between the ages 20 and 24 in the United States with a correlation coefficient (R) of -0.701 and weighted average of 74.4%, a difference of 1.9%.
In Labor Force | Age 20-24 Correlation Summary
| Measurement | Immigrants from Bulgaria | Hispanic or Latino |
| Minimum | 42.4% | 57.4% |
| Maximum | 100.0% | 80.0% |
| Range | 57.6% | 22.7% |
| Mean | 75.9% | 74.1% |
| Median | 77.9% | 74.8% |
| Interquartile 25% (IQ1) | 71.2% | 72.6% |
| Interquartile 75% (IQ3) | 82.6% | 76.6% |
| Interquartile Range (IQR) | 11.4% | 4.0% |
| Standard Deviation (Sample) | 14.3% | 3.4% |
| Standard Deviation (Population) | 13.9% | 3.4% |
Similar Demographics by In Labor Force | Age 20-24
Demographics Similar to Immigrants from Bulgaria by In Labor Force | Age 20-24
In terms of in labor force | age 20-24, the demographic groups most similar to Immigrants from Bulgaria are Pakistani (75.8%, a difference of 0.0%), Immigrants from Serbia (75.8%, a difference of 0.010%), Immigrants from Sierra Leone (75.8%, a difference of 0.020%), Immigrants from Scotland (75.8%, a difference of 0.030%), and Immigrants from Africa (75.8%, a difference of 0.040%).
| Demographics | Rating | Rank | In Labor Force | Age 20-24 |
| Immigrants | North America | 95.0 /100 | #116 | Exceptional 75.9% |
| Assyrians/Chaldeans/Syriacs | 94.9 /100 | #117 | Exceptional 75.9% |
| Spanish Americans | 94.8 /100 | #118 | Exceptional 75.8% |
| Immigrants | Portugal | 94.8 /100 | #119 | Exceptional 75.8% |
| Immigrants | Africa | 94.6 /100 | #120 | Exceptional 75.8% |
| Immigrants | Serbia | 94.3 /100 | #121 | Exceptional 75.8% |
| Pakistanis | 94.1 /100 | #122 | Exceptional 75.8% |
| Immigrants | Bulgaria | 94.1 /100 | #123 | Exceptional 75.8% |
| Immigrants | Sierra Leone | 93.8 /100 | #124 | Exceptional 75.8% |
| Immigrants | Scotland | 93.7 /100 | #125 | Exceptional 75.8% |
| Brazilians | 93.0 /100 | #126 | Exceptional 75.8% |
| Sub-Saharan Africans | 90.9 /100 | #127 | Exceptional 75.7% |
| Immigrants | Afghanistan | 89.4 /100 | #128 | Excellent 75.6% |
| Iroquois | 89.1 /100 | #129 | Excellent 75.6% |
| Immigrants | Austria | 88.8 /100 | #130 | Excellent 75.6% |
Demographics Similar to Hispanics or Latinos by In Labor Force | Age 20-24
In terms of in labor force | age 20-24, the demographic groups most similar to Hispanics or Latinos are Seminole (74.3%, a difference of 0.060%), Immigrants from India (74.4%, a difference of 0.090%), Chickasaw (74.5%, a difference of 0.10%), Ghanaian (74.3%, a difference of 0.10%), and Immigrants from Norway (74.5%, a difference of 0.11%).
| Demographics | Rating | Rank | In Labor Force | Age 20-24 |
| Immigrants | Kuwait | 12.7 /100 | #216 | Poor 74.5% |
| Chileans | 12.5 /100 | #217 | Poor 74.5% |
| Immigrants | Peru | 10.6 /100 | #218 | Poor 74.5% |
| Nepalese | 10.5 /100 | #219 | Poor 74.5% |
| Immigrants | Norway | 10.3 /100 | #220 | Poor 74.5% |
| Chickasaw | 10.3 /100 | #221 | Poor 74.5% |
| Immigrants | India | 9.9 /100 | #222 | Tragic 74.4% |
| Hispanics or Latinos | 7.9 /100 | #223 | Tragic 74.4% |
| Seminole | 6.9 /100 | #224 | Tragic 74.3% |
| Ghanaians | 6.2 /100 | #225 | Tragic 74.3% |
| Immigrants | Fiji | 5.9 /100 | #226 | Tragic 74.3% |
| Immigrants | Ireland | 5.8 /100 | #227 | Tragic 74.3% |
| Immigrants | Ukraine | 5.1 /100 | #228 | Tragic 74.2% |
| Immigrants | Sweden | 4.6 /100 | #229 | Tragic 74.2% |
| Immigrants | Albania | 4.3 /100 | #230 | Tragic 74.2% |