Immigrants from Bulgaria vs Hopi Family Poverty
COMPARE
Immigrants from Bulgaria
Hopi
Family Poverty
Family Poverty Comparison
Immigrants from Bulgaria
Hopi
7.8%
FAMILY POVERTY
98.3/ 100
METRIC RATING
65th/ 347
METRIC RANK
15.9%
FAMILY POVERTY
0.0/ 100
METRIC RATING
337th/ 347
METRIC RANK
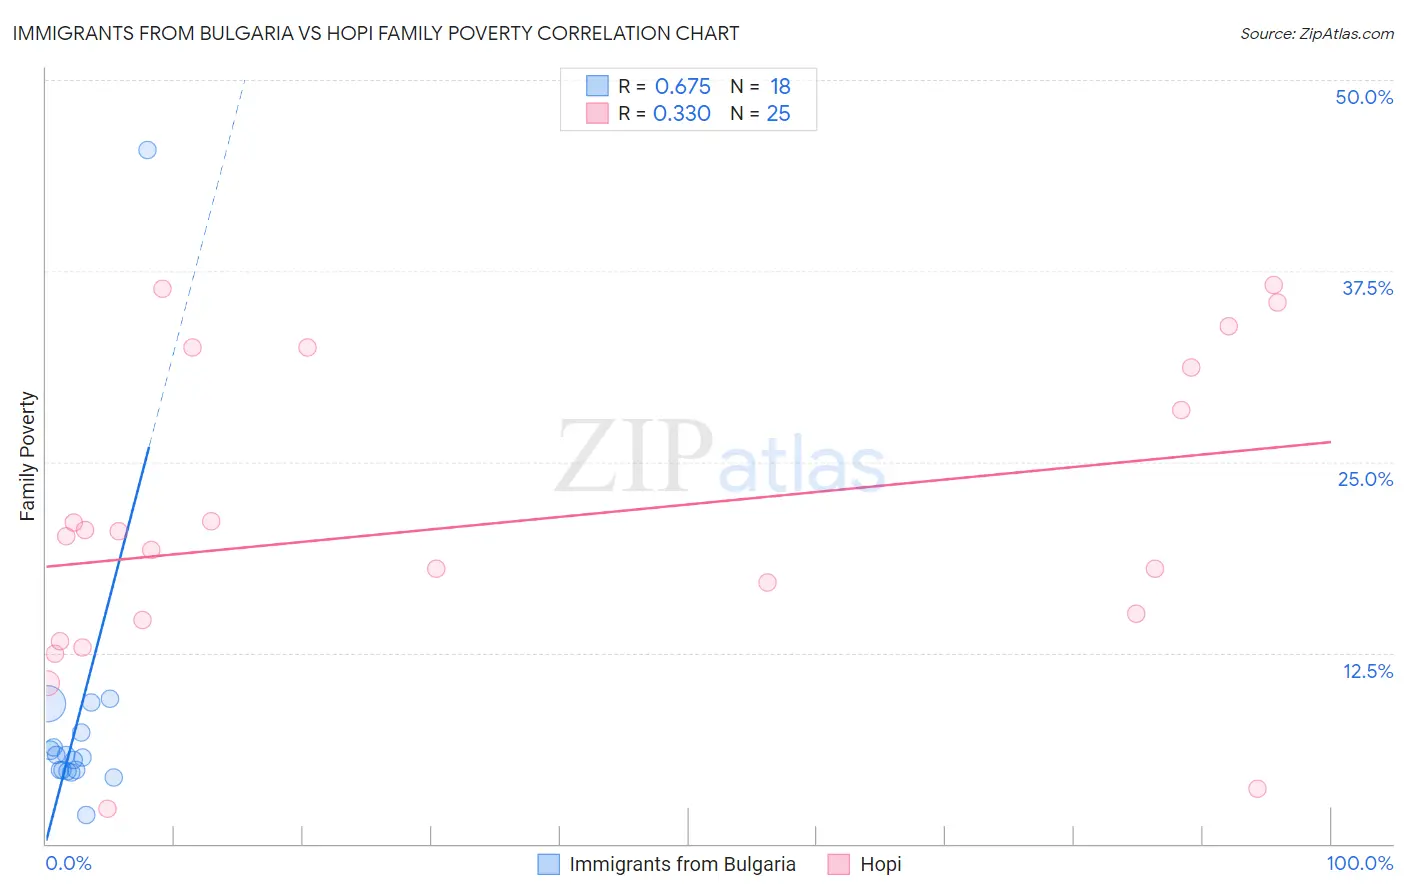
Immigrants from Bulgaria vs Hopi Family Poverty Correlation Chart
The statistical analysis conducted on geographies consisting of 172,392,882 people shows a significant positive correlation between the proportion of Immigrants from Bulgaria and poverty level among families in the United States with a correlation coefficient (R) of 0.675 and weighted average of 7.8%. Similarly, the statistical analysis conducted on geographies consisting of 74,712,354 people shows a mild positive correlation between the proportion of Hopi and poverty level among families in the United States with a correlation coefficient (R) of 0.330 and weighted average of 15.9%, a difference of 103.9%.
Family Poverty Correlation Summary
| Measurement | Immigrants from Bulgaria | Hopi |
| Minimum | 1.9% | 2.3% |
| Maximum | 45.5% | 36.6% |
| Range | 43.6% | 34.3% |
| Mean | 8.1% | 21.1% |
| Median | 5.7% | 20.1% |
| Interquartile 25% (IQ1) | 4.8% | 14.0% |
| Interquartile 75% (IQ3) | 7.3% | 31.8% |
| Interquartile Range (IQR) | 2.5% | 17.8% |
| Standard Deviation (Sample) | 9.5% | 9.9% |
| Standard Deviation (Population) | 9.2% | 9.7% |
Similar Demographics by Family Poverty
Demographics Similar to Immigrants from Bulgaria by Family Poverty
In terms of family poverty, the demographic groups most similar to Immigrants from Bulgaria are Korean (7.8%, a difference of 0.010%), Dutch (7.8%, a difference of 0.060%), Northern European (7.8%, a difference of 0.070%), Australian (7.8%, a difference of 0.11%), and Immigrants from Belgium (7.8%, a difference of 0.12%).
| Demographics | Rating | Rank | Family Poverty |
| Finns | 98.7 /100 | #58 | Exceptional 7.7% |
| Europeans | 98.7 /100 | #59 | Exceptional 7.7% |
| Immigrants | Greece | 98.7 /100 | #60 | Exceptional 7.7% |
| Immigrants | Netherlands | 98.6 /100 | #61 | Exceptional 7.7% |
| Macedonians | 98.6 /100 | #62 | Exceptional 7.8% |
| Zimbabweans | 98.4 /100 | #63 | Exceptional 7.8% |
| Koreans | 98.3 /100 | #64 | Exceptional 7.8% |
| Immigrants | Bulgaria | 98.3 /100 | #65 | Exceptional 7.8% |
| Dutch | 98.3 /100 | #66 | Exceptional 7.8% |
| Northern Europeans | 98.3 /100 | #67 | Exceptional 7.8% |
| Australians | 98.2 /100 | #68 | Exceptional 7.8% |
| Immigrants | Belgium | 98.2 /100 | #69 | Exceptional 7.8% |
| Immigrants | Canada | 98.2 /100 | #70 | Exceptional 7.8% |
| Cambodians | 98.2 /100 | #71 | Exceptional 7.8% |
| Immigrants | Romania | 98.2 /100 | #72 | Exceptional 7.8% |
Demographics Similar to Hopi by Family Poverty
In terms of family poverty, the demographic groups most similar to Hopi are Sioux (15.9%, a difference of 0.47%), Crow (16.1%, a difference of 1.1%), Yuman (16.6%, a difference of 4.5%), Pueblo (17.0%, a difference of 6.6%), and Lumbee (17.0%, a difference of 6.7%).
| Demographics | Rating | Rank | Family Poverty |
| Natives/Alaskans | 0.0 /100 | #330 | Tragic 14.3% |
| Cheyenne | 0.0 /100 | #331 | Tragic 14.3% |
| Dominicans | 0.0 /100 | #332 | Tragic 14.3% |
| Immigrants | Dominican Republic | 0.0 /100 | #333 | Tragic 14.4% |
| Houma | 0.0 /100 | #334 | Tragic 14.6% |
| Apache | 0.0 /100 | #335 | Tragic 14.7% |
| Sioux | 0.0 /100 | #336 | Tragic 15.9% |
| Hopi | 0.0 /100 | #337 | Tragic 15.9% |
| Crow | 0.0 /100 | #338 | Tragic 16.1% |
| Yuman | 0.0 /100 | #339 | Tragic 16.6% |
| Pueblo | 0.0 /100 | #340 | Tragic 17.0% |
| Lumbee | 0.0 /100 | #341 | Tragic 17.0% |
| Immigrants | Yemen | 0.0 /100 | #342 | Tragic 17.5% |
| Pima | 0.0 /100 | #343 | Tragic 18.4% |
| Yup'ik | 0.0 /100 | #344 | Tragic 18.7% |