Immigrants from Bolivia vs Immigrants from Greece Male Poverty
COMPARE
Immigrants from Bolivia
Immigrants from Greece
Male Poverty
Male Poverty Comparison
Immigrants from Bolivia
Immigrants from Greece
9.4%
MALE POVERTY
99.9/ 100
METRIC RATING
12th/ 347
METRIC RANK
9.8%
MALE POVERTY
99.3/ 100
METRIC RATING
37th/ 347
METRIC RANK
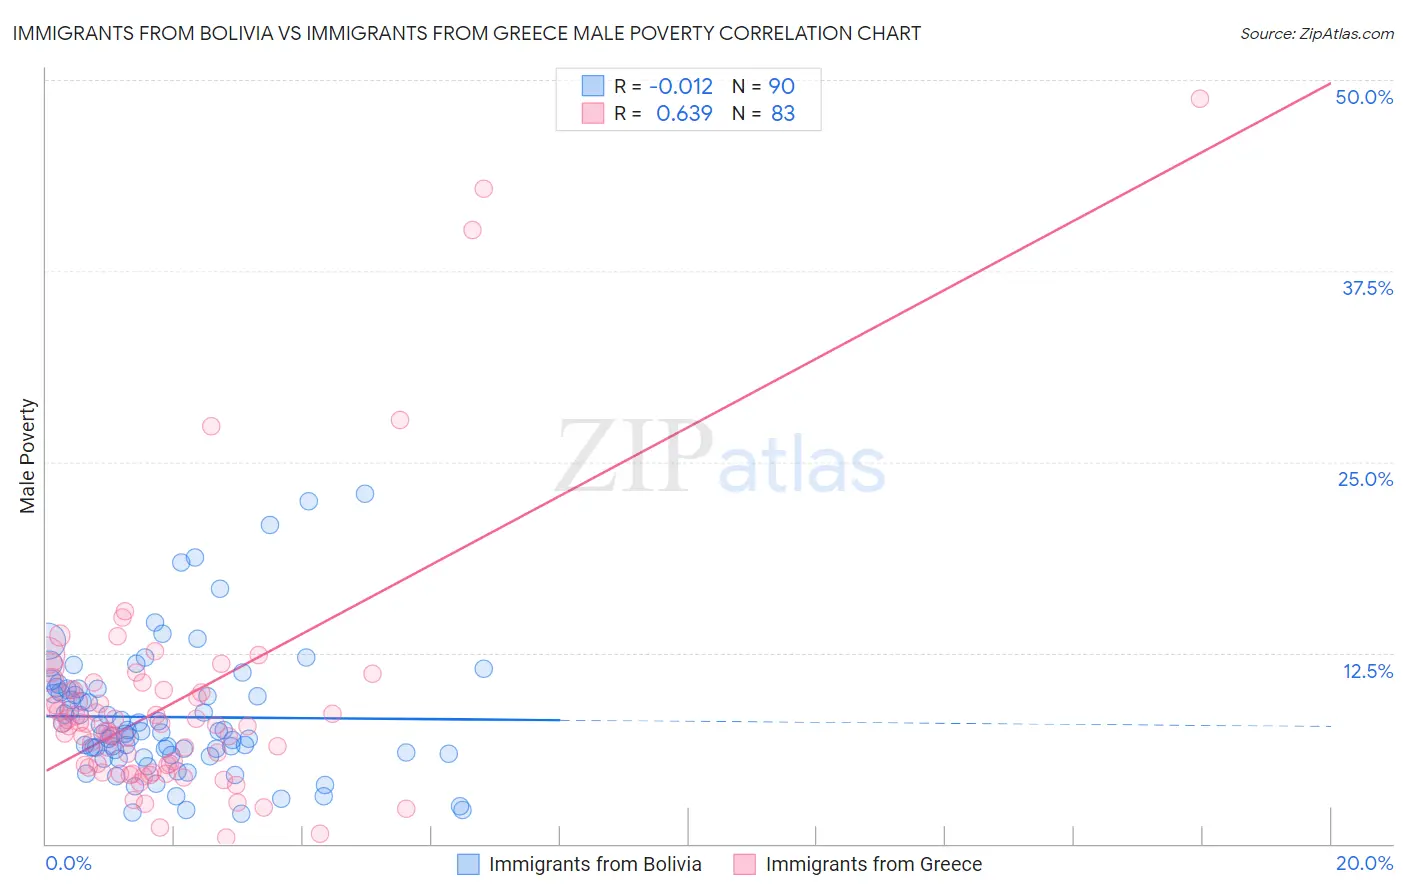
Immigrants from Bolivia vs Immigrants from Greece Male Poverty Correlation Chart
The statistical analysis conducted on geographies consisting of 158,688,041 people shows no correlation between the proportion of Immigrants from Bolivia and poverty level among males in the United States with a correlation coefficient (R) of -0.012 and weighted average of 9.4%. Similarly, the statistical analysis conducted on geographies consisting of 216,804,137 people shows a significant positive correlation between the proportion of Immigrants from Greece and poverty level among males in the United States with a correlation coefficient (R) of 0.639 and weighted average of 9.8%, a difference of 4.6%.
Male Poverty Correlation Summary
| Measurement | Immigrants from Bolivia | Immigrants from Greece |
| Minimum | 2.0% | 0.43% |
| Maximum | 22.9% | 48.8% |
| Range | 20.9% | 48.3% |
| Mean | 8.3% | 9.2% |
| Median | 7.3% | 7.7% |
| Interquartile 25% (IQ1) | 5.9% | 5.0% |
| Interquartile 75% (IQ3) | 10.1% | 10.1% |
| Interquartile Range (IQR) | 4.2% | 5.1% |
| Standard Deviation (Sample) | 4.3% | 8.1% |
| Standard Deviation (Population) | 4.2% | 8.1% |
Similar Demographics by Male Poverty
Demographics Similar to Immigrants from Bolivia by Male Poverty
In terms of male poverty, the demographic groups most similar to Immigrants from Bolivia are Bolivian (9.4%, a difference of 0.050%), Immigrants from Lithuania (9.4%, a difference of 0.12%), Immigrants from North Macedonia (9.4%, a difference of 0.50%), Bulgarian (9.3%, a difference of 0.69%), and Bhutanese (9.5%, a difference of 0.79%).
| Demographics | Rating | Rank | Male Poverty |
| Maltese | 100.0 /100 | #5 | Exceptional 9.1% |
| Assyrians/Chaldeans/Syriacs | 99.9 /100 | #6 | Exceptional 9.1% |
| Immigrants | Ireland | 99.9 /100 | #7 | Exceptional 9.1% |
| Filipinos | 99.9 /100 | #8 | Exceptional 9.2% |
| Immigrants | South Central Asia | 99.9 /100 | #9 | Exceptional 9.3% |
| Bulgarians | 99.9 /100 | #10 | Exceptional 9.3% |
| Bolivians | 99.9 /100 | #11 | Exceptional 9.4% |
| Immigrants | Bolivia | 99.9 /100 | #12 | Exceptional 9.4% |
| Immigrants | Lithuania | 99.9 /100 | #13 | Exceptional 9.4% |
| Immigrants | North Macedonia | 99.8 /100 | #14 | Exceptional 9.4% |
| Bhutanese | 99.8 /100 | #15 | Exceptional 9.5% |
| Luxembourgers | 99.8 /100 | #16 | Exceptional 9.5% |
| Norwegians | 99.8 /100 | #17 | Exceptional 9.5% |
| Lithuanians | 99.8 /100 | #18 | Exceptional 9.5% |
| Immigrants | Hong Kong | 99.7 /100 | #19 | Exceptional 9.6% |
Demographics Similar to Immigrants from Greece by Male Poverty
In terms of male poverty, the demographic groups most similar to Immigrants from Greece are Czech (9.8%, a difference of 0.22%), Iranian (9.8%, a difference of 0.31%), Immigrants from Pakistan (9.9%, a difference of 0.37%), Russian (9.9%, a difference of 0.38%), and Cypriot (9.9%, a difference of 0.46%).
| Demographics | Rating | Rank | Male Poverty |
| Poles | 99.5 /100 | #30 | Exceptional 9.7% |
| Tongans | 99.5 /100 | #31 | Exceptional 9.7% |
| Macedonians | 99.5 /100 | #32 | Exceptional 9.7% |
| Immigrants | Northern Europe | 99.5 /100 | #33 | Exceptional 9.7% |
| Immigrants | Poland | 99.5 /100 | #34 | Exceptional 9.8% |
| Iranians | 99.4 /100 | #35 | Exceptional 9.8% |
| Czechs | 99.4 /100 | #36 | Exceptional 9.8% |
| Immigrants | Greece | 99.3 /100 | #37 | Exceptional 9.8% |
| Immigrants | Pakistan | 99.2 /100 | #38 | Exceptional 9.9% |
| Russians | 99.2 /100 | #39 | Exceptional 9.9% |
| Cypriots | 99.2 /100 | #40 | Exceptional 9.9% |
| Koreans | 99.2 /100 | #41 | Exceptional 9.9% |
| Immigrants | Iran | 99.1 /100 | #42 | Exceptional 9.9% |
| Immigrants | Moldova | 99.0 /100 | #43 | Exceptional 9.9% |
| Immigrants | Romania | 98.9 /100 | #44 | Exceptional 9.9% |