Immigrants from Middle Africa vs Immigrants from Greece Male Poverty
COMPARE
Immigrants from Middle Africa
Immigrants from Greece
Male Poverty
Male Poverty Comparison
Immigrants from Middle Africa
Immigrants from Greece
12.7%
MALE POVERTY
0.4/ 100
METRIC RATING
240th/ 347
METRIC RANK
9.8%
MALE POVERTY
99.3/ 100
METRIC RATING
37th/ 347
METRIC RANK
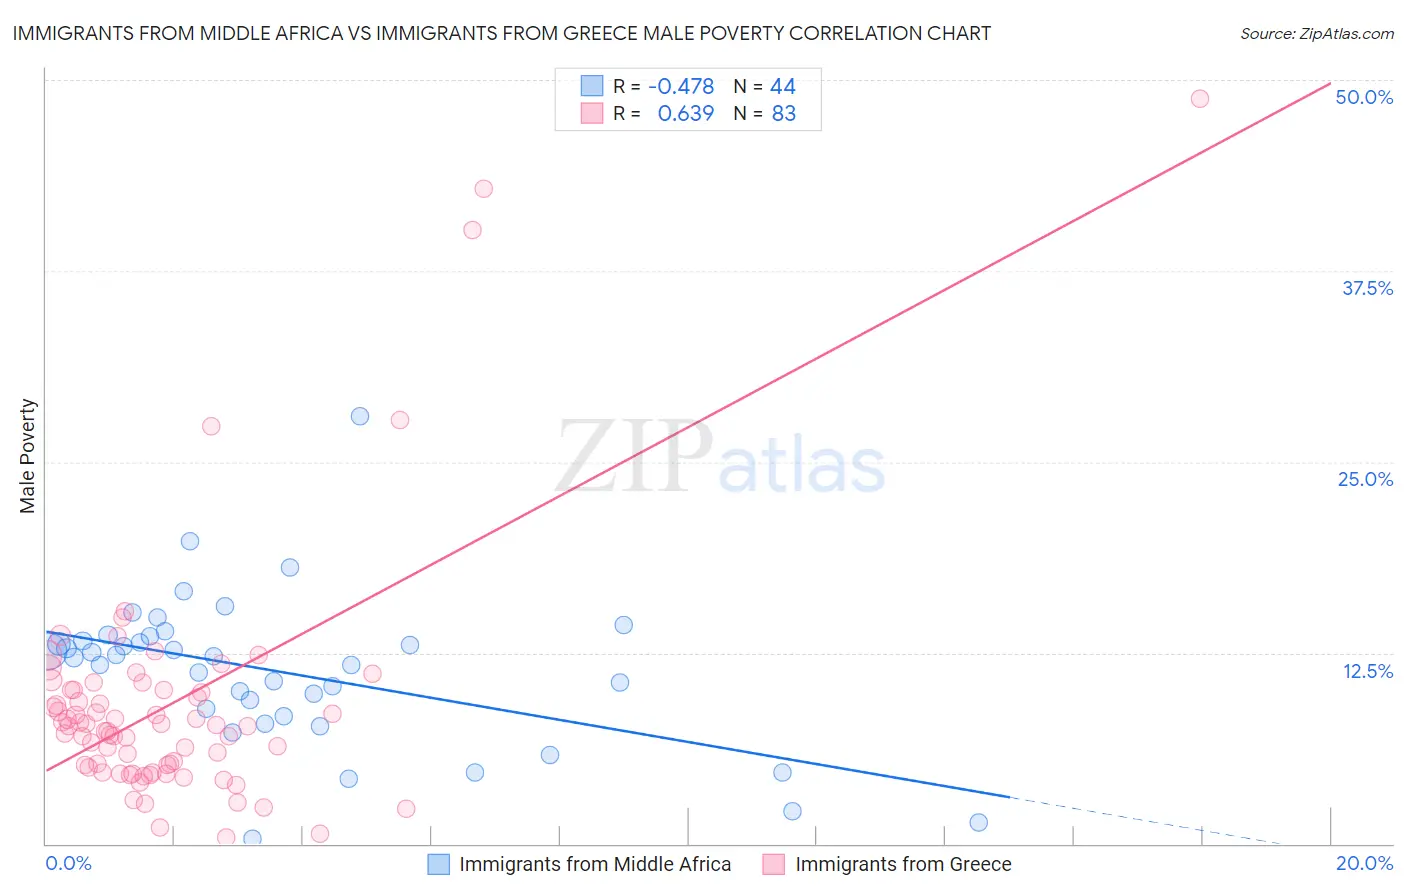
Immigrants from Middle Africa vs Immigrants from Greece Male Poverty Correlation Chart
The statistical analysis conducted on geographies consisting of 202,607,111 people shows a moderate negative correlation between the proportion of Immigrants from Middle Africa and poverty level among males in the United States with a correlation coefficient (R) of -0.478 and weighted average of 12.7%. Similarly, the statistical analysis conducted on geographies consisting of 216,804,137 people shows a significant positive correlation between the proportion of Immigrants from Greece and poverty level among males in the United States with a correlation coefficient (R) of 0.639 and weighted average of 9.8%, a difference of 29.5%.
Male Poverty Correlation Summary
| Measurement | Immigrants from Middle Africa | Immigrants from Greece |
| Minimum | 0.33% | 0.43% |
| Maximum | 28.0% | 48.8% |
| Range | 27.6% | 48.3% |
| Mean | 11.3% | 9.2% |
| Median | 12.3% | 7.7% |
| Interquartile 25% (IQ1) | 8.6% | 5.0% |
| Interquartile 75% (IQ3) | 13.4% | 10.1% |
| Interquartile Range (IQR) | 4.9% | 5.1% |
| Standard Deviation (Sample) | 5.0% | 8.1% |
| Standard Deviation (Population) | 4.9% | 8.1% |
Similar Demographics by Male Poverty
Demographics Similar to Immigrants from Middle Africa by Male Poverty
In terms of male poverty, the demographic groups most similar to Immigrants from Middle Africa are Ghanaian (12.7%, a difference of 0.27%), Ecuadorian (12.7%, a difference of 0.28%), French American Indian (12.7%, a difference of 0.31%), Immigrants from Saudi Arabia (12.7%, a difference of 0.35%), and Sudanese (12.8%, a difference of 0.36%).
| Demographics | Rating | Rank | Male Poverty |
| Fijians | 0.6 /100 | #233 | Tragic 12.6% |
| Immigrants | Armenia | 0.6 /100 | #234 | Tragic 12.6% |
| Immigrants | Laos | 0.5 /100 | #235 | Tragic 12.6% |
| Immigrants | Saudi Arabia | 0.4 /100 | #236 | Tragic 12.7% |
| French American Indians | 0.4 /100 | #237 | Tragic 12.7% |
| Ecuadorians | 0.4 /100 | #238 | Tragic 12.7% |
| Ghanaians | 0.4 /100 | #239 | Tragic 12.7% |
| Immigrants | Middle Africa | 0.4 /100 | #240 | Tragic 12.7% |
| Sudanese | 0.3 /100 | #241 | Tragic 12.8% |
| Nepalese | 0.3 /100 | #242 | Tragic 12.8% |
| Alaskan Athabascans | 0.3 /100 | #243 | Tragic 12.8% |
| Tsimshian | 0.3 /100 | #244 | Tragic 12.8% |
| Liberians | 0.3 /100 | #245 | Tragic 12.8% |
| Immigrants | El Salvador | 0.2 /100 | #246 | Tragic 12.8% |
| Immigrants | Western Africa | 0.2 /100 | #247 | Tragic 12.9% |
Demographics Similar to Immigrants from Greece by Male Poverty
In terms of male poverty, the demographic groups most similar to Immigrants from Greece are Czech (9.8%, a difference of 0.22%), Iranian (9.8%, a difference of 0.31%), Immigrants from Pakistan (9.9%, a difference of 0.37%), Russian (9.9%, a difference of 0.38%), and Cypriot (9.9%, a difference of 0.46%).
| Demographics | Rating | Rank | Male Poverty |
| Poles | 99.5 /100 | #30 | Exceptional 9.7% |
| Tongans | 99.5 /100 | #31 | Exceptional 9.7% |
| Macedonians | 99.5 /100 | #32 | Exceptional 9.7% |
| Immigrants | Northern Europe | 99.5 /100 | #33 | Exceptional 9.7% |
| Immigrants | Poland | 99.5 /100 | #34 | Exceptional 9.8% |
| Iranians | 99.4 /100 | #35 | Exceptional 9.8% |
| Czechs | 99.4 /100 | #36 | Exceptional 9.8% |
| Immigrants | Greece | 99.3 /100 | #37 | Exceptional 9.8% |
| Immigrants | Pakistan | 99.2 /100 | #38 | Exceptional 9.9% |
| Russians | 99.2 /100 | #39 | Exceptional 9.9% |
| Cypriots | 99.2 /100 | #40 | Exceptional 9.9% |
| Koreans | 99.2 /100 | #41 | Exceptional 9.9% |
| Immigrants | Iran | 99.1 /100 | #42 | Exceptional 9.9% |
| Immigrants | Moldova | 99.0 /100 | #43 | Exceptional 9.9% |
| Immigrants | Romania | 98.9 /100 | #44 | Exceptional 9.9% |