Taiwanese vs Immigrants from Greece Male Poverty
COMPARE
Taiwanese
Immigrants from Greece
Male Poverty
Male Poverty Comparison
Taiwanese
Immigrants from Greece
11.0%
MALE POVERTY
62.7/ 100
METRIC RATING
159th/ 347
METRIC RANK
9.8%
MALE POVERTY
99.3/ 100
METRIC RATING
37th/ 347
METRIC RANK
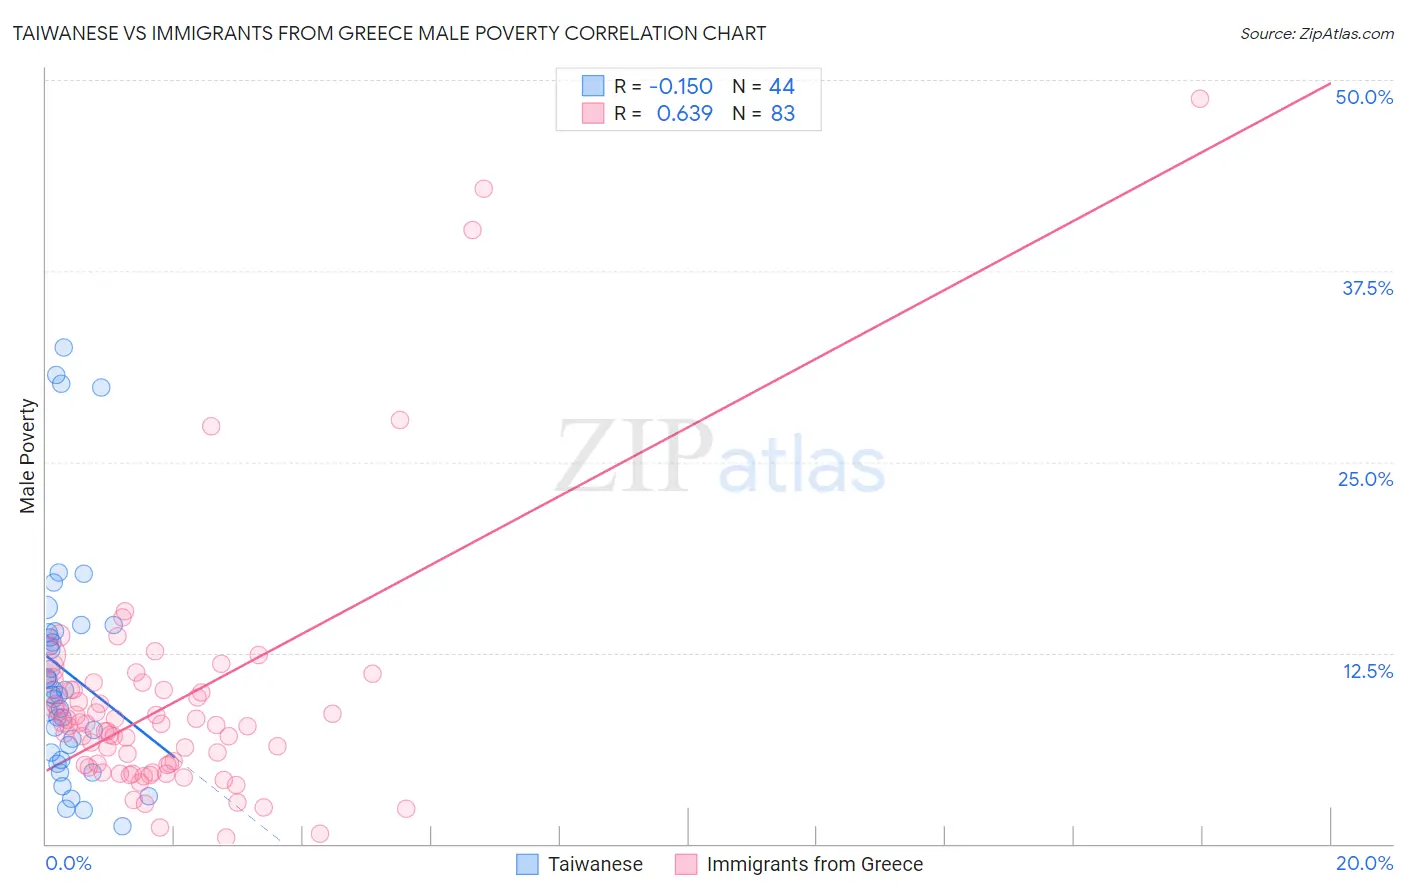
Taiwanese vs Immigrants from Greece Male Poverty Correlation Chart
The statistical analysis conducted on geographies consisting of 31,715,286 people shows a poor negative correlation between the proportion of Taiwanese and poverty level among males in the United States with a correlation coefficient (R) of -0.150 and weighted average of 11.0%. Similarly, the statistical analysis conducted on geographies consisting of 216,804,137 people shows a significant positive correlation between the proportion of Immigrants from Greece and poverty level among males in the United States with a correlation coefficient (R) of 0.639 and weighted average of 9.8%, a difference of 12.5%.
Male Poverty Correlation Summary
| Measurement | Taiwanese | Immigrants from Greece |
| Minimum | 1.2% | 0.43% |
| Maximum | 32.5% | 48.8% |
| Range | 31.3% | 48.3% |
| Mean | 11.3% | 9.2% |
| Median | 9.9% | 7.7% |
| Interquartile 25% (IQ1) | 6.2% | 5.0% |
| Interquartile 75% (IQ3) | 13.9% | 10.1% |
| Interquartile Range (IQR) | 7.6% | 5.1% |
| Standard Deviation (Sample) | 7.6% | 8.1% |
| Standard Deviation (Population) | 7.5% | 8.1% |
Similar Demographics by Male Poverty
Demographics Similar to Taiwanese by Male Poverty
In terms of male poverty, the demographic groups most similar to Taiwanese are Colombian (11.0%, a difference of 0.030%), Scotch-Irish (11.0%, a difference of 0.10%), Costa Rican (11.0%, a difference of 0.12%), Immigrants from Kazakhstan (11.0%, a difference of 0.22%), and Immigrants from Malaysia (11.0%, a difference of 0.22%).
| Demographics | Rating | Rank | Male Poverty |
| Immigrants | Nepal | 67.3 /100 | #152 | Good 11.0% |
| Immigrants | Bosnia and Herzegovina | 65.2 /100 | #153 | Good 11.0% |
| Immigrants | Kazakhstan | 64.8 /100 | #154 | Good 11.0% |
| Immigrants | Malaysia | 64.7 /100 | #155 | Good 11.0% |
| Costa Ricans | 63.9 /100 | #156 | Good 11.0% |
| Scotch-Irish | 63.7 /100 | #157 | Good 11.0% |
| Colombians | 63.0 /100 | #158 | Good 11.0% |
| Taiwanese | 62.7 /100 | #159 | Good 11.0% |
| Soviet Union | 60.3 /100 | #160 | Good 11.1% |
| Immigrants | Northern Africa | 59.7 /100 | #161 | Average 11.1% |
| Immigrants | Chile | 57.4 /100 | #162 | Average 11.1% |
| Whites/Caucasians | 56.7 /100 | #163 | Average 11.1% |
| Ethiopians | 56.7 /100 | #164 | Average 11.1% |
| Immigrants | Spain | 55.5 /100 | #165 | Average 11.1% |
| Immigrants | Albania | 55.3 /100 | #166 | Average 11.1% |
Demographics Similar to Immigrants from Greece by Male Poverty
In terms of male poverty, the demographic groups most similar to Immigrants from Greece are Czech (9.8%, a difference of 0.22%), Iranian (9.8%, a difference of 0.31%), Immigrants from Pakistan (9.9%, a difference of 0.37%), Russian (9.9%, a difference of 0.38%), and Cypriot (9.9%, a difference of 0.46%).
| Demographics | Rating | Rank | Male Poverty |
| Poles | 99.5 /100 | #30 | Exceptional 9.7% |
| Tongans | 99.5 /100 | #31 | Exceptional 9.7% |
| Macedonians | 99.5 /100 | #32 | Exceptional 9.7% |
| Immigrants | Northern Europe | 99.5 /100 | #33 | Exceptional 9.7% |
| Immigrants | Poland | 99.5 /100 | #34 | Exceptional 9.8% |
| Iranians | 99.4 /100 | #35 | Exceptional 9.8% |
| Czechs | 99.4 /100 | #36 | Exceptional 9.8% |
| Immigrants | Greece | 99.3 /100 | #37 | Exceptional 9.8% |
| Immigrants | Pakistan | 99.2 /100 | #38 | Exceptional 9.9% |
| Russians | 99.2 /100 | #39 | Exceptional 9.9% |
| Cypriots | 99.2 /100 | #40 | Exceptional 9.9% |
| Koreans | 99.2 /100 | #41 | Exceptional 9.9% |
| Immigrants | Iran | 99.1 /100 | #42 | Exceptional 9.9% |
| Immigrants | Moldova | 99.0 /100 | #43 | Exceptional 9.9% |
| Immigrants | Romania | 98.9 /100 | #44 | Exceptional 9.9% |