Immigrants from Belize vs Immigrants from Scotland Child Poverty Under the Age of 5
COMPARE
Immigrants from Belize
Immigrants from Scotland
Child Poverty Under the Age of 5
Child Poverty Under the Age of 5 Comparison
Immigrants from Belize
Immigrants from Scotland
20.6%
CHILD POVERTY UNDER THE AGE OF 5
0.1/ 100
METRIC RATING
274th/ 347
METRIC RANK
15.2%
CHILD POVERTY UNDER THE AGE OF 5
99.0/ 100
METRIC RATING
66th/ 347
METRIC RANK
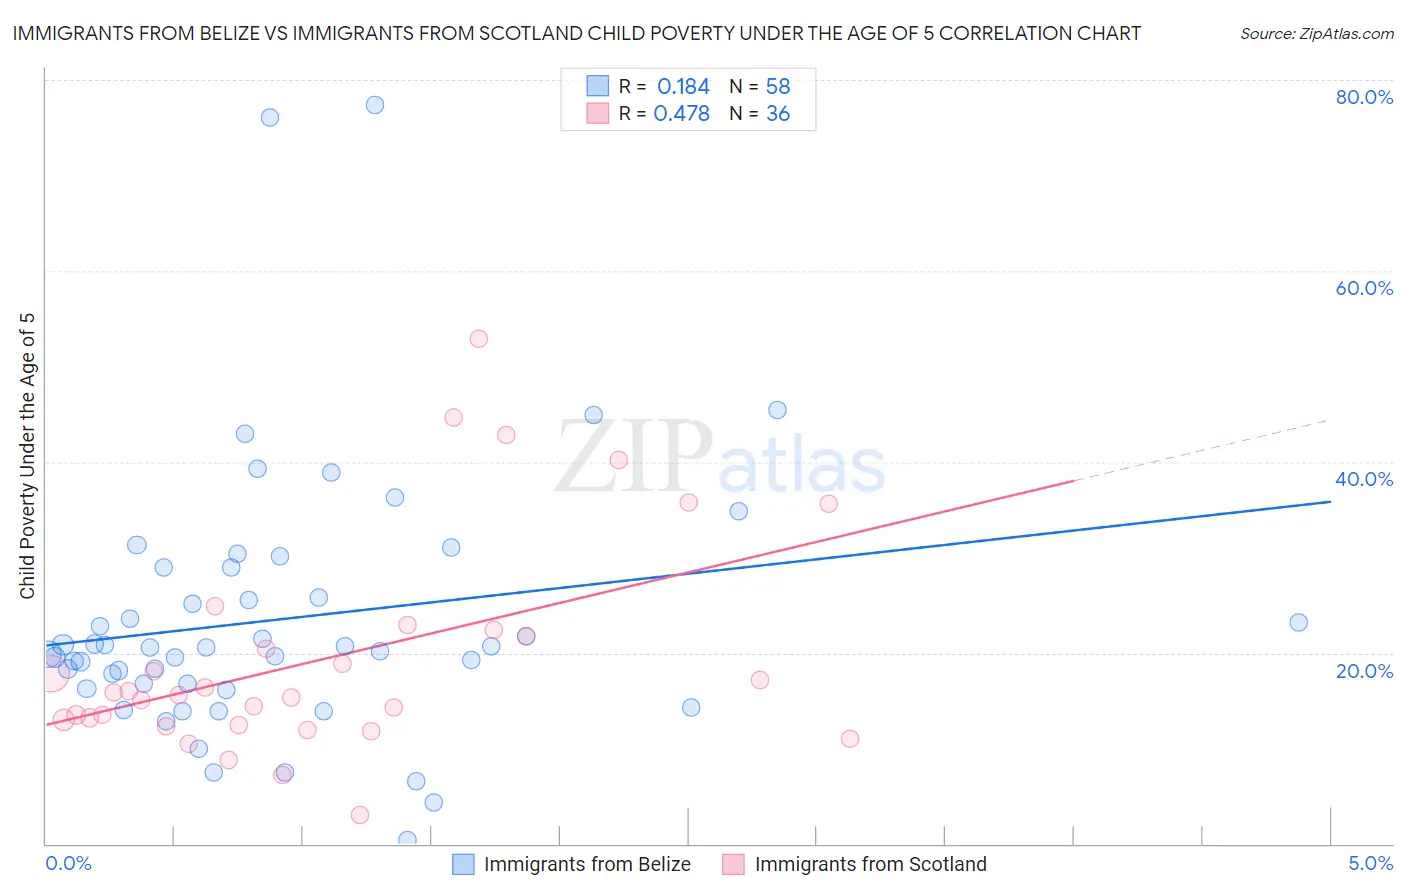
Immigrants from Belize vs Immigrants from Scotland Child Poverty Under the Age of 5 Correlation Chart
The statistical analysis conducted on geographies consisting of 129,008,475 people shows a poor positive correlation between the proportion of Immigrants from Belize and poverty level among children under the age of 5 in the United States with a correlation coefficient (R) of 0.184 and weighted average of 20.6%. Similarly, the statistical analysis conducted on geographies consisting of 190,045,386 people shows a moderate positive correlation between the proportion of Immigrants from Scotland and poverty level among children under the age of 5 in the United States with a correlation coefficient (R) of 0.478 and weighted average of 15.2%, a difference of 35.9%.
Child Poverty Under the Age of 5 Correlation Summary
| Measurement | Immigrants from Belize | Immigrants from Scotland |
| Minimum | 0.34% | 3.0% |
| Maximum | 77.4% | 52.8% |
| Range | 77.1% | 49.8% |
| Mean | 23.5% | 19.5% |
| Median | 20.6% | 15.7% |
| Interquartile 25% (IQ1) | 16.8% | 12.7% |
| Interquartile 75% (IQ3) | 28.9% | 22.0% |
| Interquartile Range (IQR) | 12.1% | 9.3% |
| Standard Deviation (Sample) | 13.9% | 11.4% |
| Standard Deviation (Population) | 13.8% | 11.2% |
Similar Demographics by Child Poverty Under the Age of 5
Demographics Similar to Immigrants from Belize by Child Poverty Under the Age of 5
In terms of child poverty under the age of 5, the demographic groups most similar to Immigrants from Belize are Bangladeshi (20.6%, a difference of 0.050%), Central American (20.6%, a difference of 0.10%), West Indian (20.6%, a difference of 0.14%), Immigrants from West Indies (20.7%, a difference of 0.31%), and Immigrants from Grenada (20.7%, a difference of 0.33%).
| Demographics | Rating | Rank | Child Poverty Under the Age of 5 |
| Ottawa | 0.1 /100 | #267 | Tragic 20.3% |
| Belizeans | 0.1 /100 | #268 | Tragic 20.3% |
| Immigrants | Burma/Myanmar | 0.1 /100 | #269 | Tragic 20.4% |
| Jamaicans | 0.1 /100 | #270 | Tragic 20.4% |
| Americans | 0.1 /100 | #271 | Tragic 20.5% |
| Immigrants | Jamaica | 0.1 /100 | #272 | Tragic 20.5% |
| Central Americans | 0.1 /100 | #273 | Tragic 20.6% |
| Immigrants | Belize | 0.1 /100 | #274 | Tragic 20.6% |
| Bangladeshis | 0.1 /100 | #275 | Tragic 20.6% |
| West Indians | 0.0 /100 | #276 | Tragic 20.6% |
| Immigrants | West Indies | 0.0 /100 | #277 | Tragic 20.7% |
| Immigrants | Grenada | 0.0 /100 | #278 | Tragic 20.7% |
| Sub-Saharan Africans | 0.0 /100 | #279 | Tragic 20.8% |
| French American Indians | 0.0 /100 | #280 | Tragic 20.8% |
| Senegalese | 0.0 /100 | #281 | Tragic 20.9% |
Demographics Similar to Immigrants from Scotland by Child Poverty Under the Age of 5
In terms of child poverty under the age of 5, the demographic groups most similar to Immigrants from Scotland are Greek (15.2%, a difference of 0.060%), Zimbabwean (15.2%, a difference of 0.070%), Lithuanian (15.2%, a difference of 0.080%), Immigrants from Fiji (15.2%, a difference of 0.11%), and Immigrants from Romania (15.2%, a difference of 0.14%).
| Demographics | Rating | Rank | Child Poverty Under the Age of 5 |
| Paraguayans | 99.4 /100 | #59 | Exceptional 15.0% |
| Immigrants | Russia | 99.3 /100 | #60 | Exceptional 15.0% |
| Immigrants | Poland | 99.1 /100 | #61 | Exceptional 15.1% |
| Immigrants | Eastern Europe | 99.1 /100 | #62 | Exceptional 15.1% |
| Immigrants | Europe | 99.1 /100 | #63 | Exceptional 15.1% |
| Immigrants | Romania | 99.1 /100 | #64 | Exceptional 15.2% |
| Immigrants | Fiji | 99.0 /100 | #65 | Exceptional 15.2% |
| Immigrants | Scotland | 99.0 /100 | #66 | Exceptional 15.2% |
| Greeks | 99.0 /100 | #67 | Exceptional 15.2% |
| Zimbabweans | 99.0 /100 | #68 | Exceptional 15.2% |
| Lithuanians | 99.0 /100 | #69 | Exceptional 15.2% |
| Immigrants | Belgium | 98.8 /100 | #70 | Exceptional 15.3% |
| Immigrants | Egypt | 98.8 /100 | #71 | Exceptional 15.3% |
| Immigrants | Sweden | 98.8 /100 | #72 | Exceptional 15.3% |
| Immigrants | Ukraine | 98.7 /100 | #73 | Exceptional 15.3% |