Ethiopian vs Immigrants from Scotland Child Poverty Under the Age of 5
COMPARE
Ethiopian
Immigrants from Scotland
Child Poverty Under the Age of 5
Child Poverty Under the Age of 5 Comparison
Ethiopians
Immigrants from Scotland
16.5%
CHILD POVERTY UNDER THE AGE OF 5
82.7/ 100
METRIC RATING
144th/ 347
METRIC RANK
15.2%
CHILD POVERTY UNDER THE AGE OF 5
99.0/ 100
METRIC RATING
66th/ 347
METRIC RANK
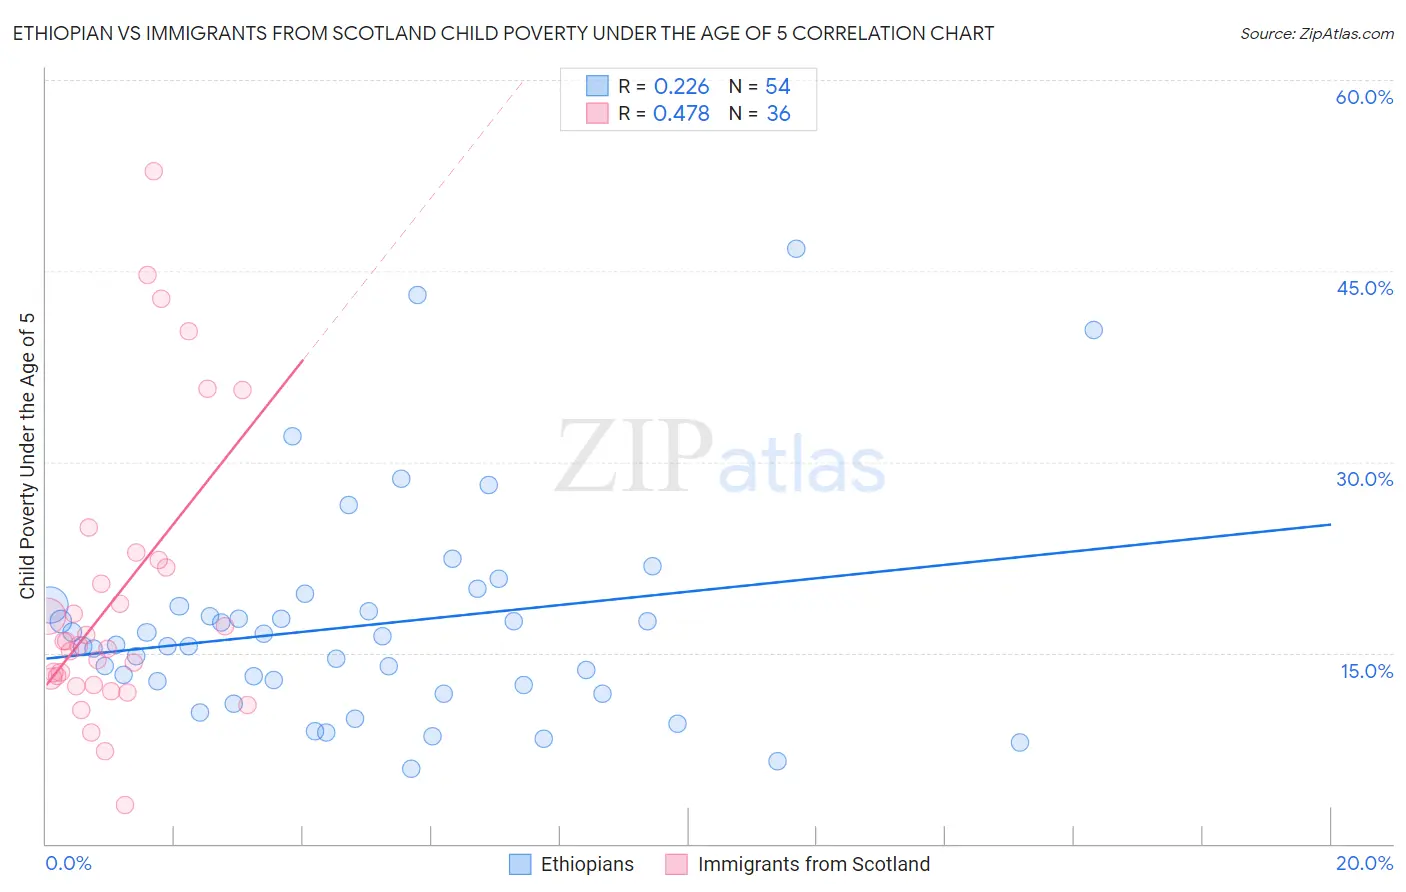
Ethiopian vs Immigrants from Scotland Child Poverty Under the Age of 5 Correlation Chart
The statistical analysis conducted on geographies consisting of 218,832,621 people shows a weak positive correlation between the proportion of Ethiopians and poverty level among children under the age of 5 in the United States with a correlation coefficient (R) of 0.226 and weighted average of 16.5%. Similarly, the statistical analysis conducted on geographies consisting of 190,045,386 people shows a moderate positive correlation between the proportion of Immigrants from Scotland and poverty level among children under the age of 5 in the United States with a correlation coefficient (R) of 0.478 and weighted average of 15.2%, a difference of 9.0%.
Child Poverty Under the Age of 5 Correlation Summary
| Measurement | Ethiopian | Immigrants from Scotland |
| Minimum | 5.9% | 3.0% |
| Maximum | 46.8% | 52.8% |
| Range | 40.9% | 49.8% |
| Mean | 17.2% | 19.5% |
| Median | 15.6% | 15.7% |
| Interquartile 25% (IQ1) | 12.5% | 12.7% |
| Interquartile 75% (IQ3) | 18.6% | 22.0% |
| Interquartile Range (IQR) | 6.2% | 9.3% |
| Standard Deviation (Sample) | 8.4% | 11.4% |
| Standard Deviation (Population) | 8.4% | 11.2% |
Similar Demographics by Child Poverty Under the Age of 5
Demographics Similar to Ethiopians by Child Poverty Under the Age of 5
In terms of child poverty under the age of 5, the demographic groups most similar to Ethiopians are Samoan (16.5%, a difference of 0.060%), Portuguese (16.5%, a difference of 0.070%), Immigrants from Western Europe (16.5%, a difference of 0.11%), Immigrants from Ethiopia (16.6%, a difference of 0.11%), and Israeli (16.6%, a difference of 0.12%).
| Demographics | Rating | Rank | Child Poverty Under the Age of 5 |
| Immigrants | Chile | 85.3 /100 | #137 | Excellent 16.4% |
| Germans | 84.8 /100 | #138 | Excellent 16.5% |
| Immigrants | Hungary | 84.5 /100 | #139 | Excellent 16.5% |
| Guamanians/Chamorros | 84.2 /100 | #140 | Excellent 16.5% |
| Immigrants | Western Europe | 83.3 /100 | #141 | Excellent 16.5% |
| Portuguese | 83.0 /100 | #142 | Excellent 16.5% |
| Samoans | 83.0 /100 | #143 | Excellent 16.5% |
| Ethiopians | 82.7 /100 | #144 | Excellent 16.5% |
| Immigrants | Ethiopia | 82.1 /100 | #145 | Excellent 16.6% |
| Israelis | 82.0 /100 | #146 | Excellent 16.6% |
| Immigrants | Nepal | 80.3 /100 | #147 | Excellent 16.6% |
| Syrians | 79.1 /100 | #148 | Good 16.6% |
| New Zealanders | 78.7 /100 | #149 | Good 16.6% |
| Colombians | 77.8 /100 | #150 | Good 16.7% |
| Canadians | 77.6 /100 | #151 | Good 16.7% |
Demographics Similar to Immigrants from Scotland by Child Poverty Under the Age of 5
In terms of child poverty under the age of 5, the demographic groups most similar to Immigrants from Scotland are Greek (15.2%, a difference of 0.060%), Zimbabwean (15.2%, a difference of 0.070%), Lithuanian (15.2%, a difference of 0.080%), Immigrants from Fiji (15.2%, a difference of 0.11%), and Immigrants from Romania (15.2%, a difference of 0.14%).
| Demographics | Rating | Rank | Child Poverty Under the Age of 5 |
| Paraguayans | 99.4 /100 | #59 | Exceptional 15.0% |
| Immigrants | Russia | 99.3 /100 | #60 | Exceptional 15.0% |
| Immigrants | Poland | 99.1 /100 | #61 | Exceptional 15.1% |
| Immigrants | Eastern Europe | 99.1 /100 | #62 | Exceptional 15.1% |
| Immigrants | Europe | 99.1 /100 | #63 | Exceptional 15.1% |
| Immigrants | Romania | 99.1 /100 | #64 | Exceptional 15.2% |
| Immigrants | Fiji | 99.0 /100 | #65 | Exceptional 15.2% |
| Immigrants | Scotland | 99.0 /100 | #66 | Exceptional 15.2% |
| Greeks | 99.0 /100 | #67 | Exceptional 15.2% |
| Zimbabweans | 99.0 /100 | #68 | Exceptional 15.2% |
| Lithuanians | 99.0 /100 | #69 | Exceptional 15.2% |
| Immigrants | Belgium | 98.8 /100 | #70 | Exceptional 15.3% |
| Immigrants | Egypt | 98.8 /100 | #71 | Exceptional 15.3% |
| Immigrants | Sweden | 98.8 /100 | #72 | Exceptional 15.3% |
| Immigrants | Ukraine | 98.7 /100 | #73 | Exceptional 15.3% |