Immigrants from Belize vs Immigrants from Iraq Child Poverty Under the Age of 5
COMPARE
Immigrants from Belize
Immigrants from Iraq
Child Poverty Under the Age of 5
Child Poverty Under the Age of 5 Comparison
Immigrants from Belize
Immigrants from Iraq
20.6%
CHILD POVERTY UNDER THE AGE OF 5
0.1/ 100
METRIC RATING
274th/ 347
METRIC RANK
17.3%
CHILD POVERTY UNDER THE AGE OF 5
45.2/ 100
METRIC RATING
176th/ 347
METRIC RANK
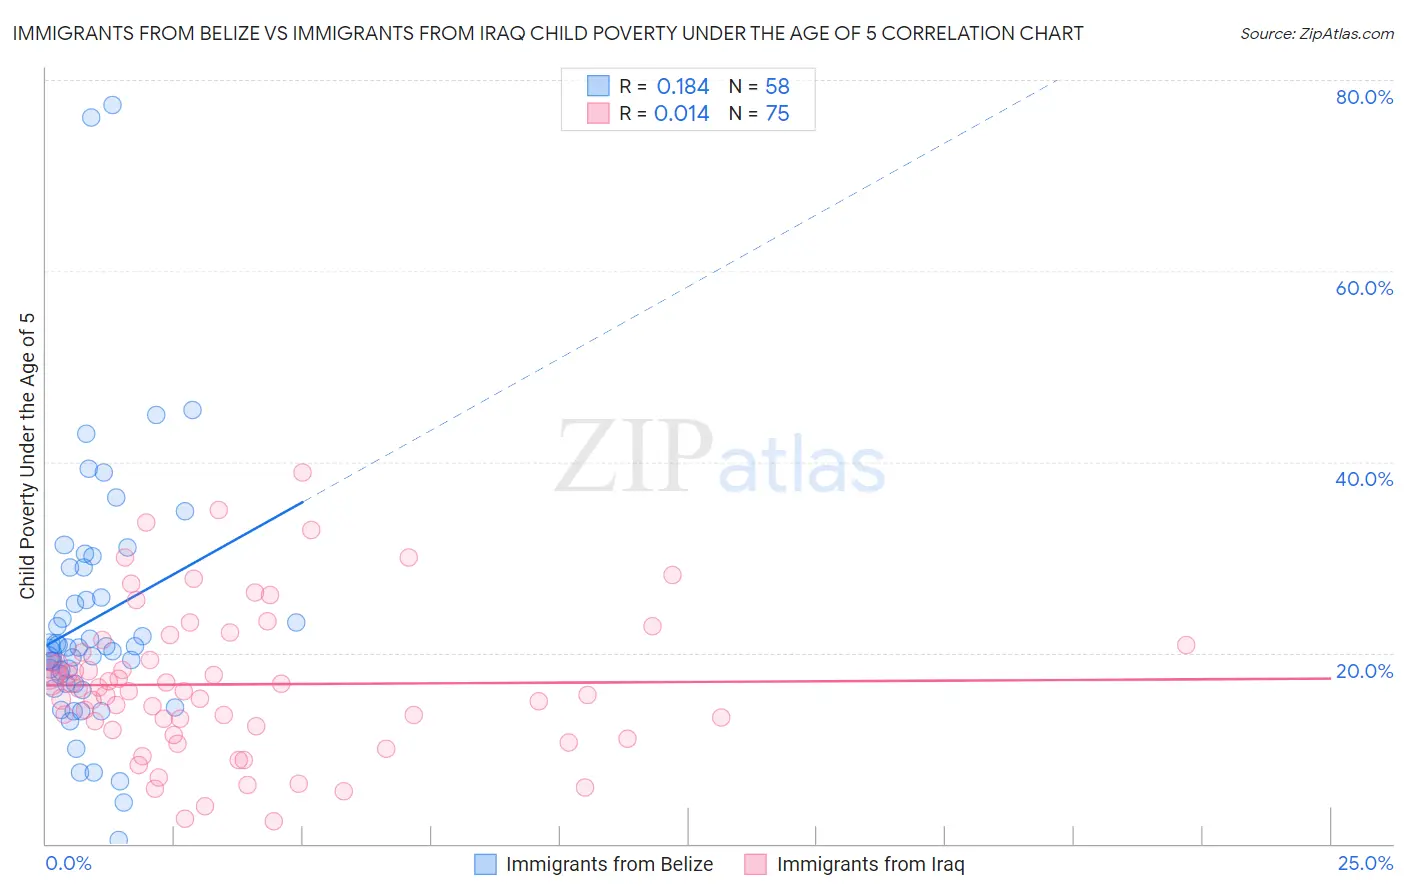
Immigrants from Belize vs Immigrants from Iraq Child Poverty Under the Age of 5 Correlation Chart
The statistical analysis conducted on geographies consisting of 129,008,475 people shows a poor positive correlation between the proportion of Immigrants from Belize and poverty level among children under the age of 5 in the United States with a correlation coefficient (R) of 0.184 and weighted average of 20.6%. Similarly, the statistical analysis conducted on geographies consisting of 190,454,654 people shows no correlation between the proportion of Immigrants from Iraq and poverty level among children under the age of 5 in the United States with a correlation coefficient (R) of 0.014 and weighted average of 17.3%, a difference of 19.0%.
Child Poverty Under the Age of 5 Correlation Summary
| Measurement | Immigrants from Belize | Immigrants from Iraq |
| Minimum | 0.34% | 2.4% |
| Maximum | 77.4% | 38.9% |
| Range | 77.1% | 36.5% |
| Mean | 23.5% | 16.7% |
| Median | 20.6% | 16.0% |
| Interquartile 25% (IQ1) | 16.8% | 11.9% |
| Interquartile 75% (IQ3) | 28.9% | 20.9% |
| Interquartile Range (IQR) | 12.1% | 9.0% |
| Standard Deviation (Sample) | 13.9% | 7.7% |
| Standard Deviation (Population) | 13.8% | 7.7% |
Similar Demographics by Child Poverty Under the Age of 5
Demographics Similar to Immigrants from Belize by Child Poverty Under the Age of 5
In terms of child poverty under the age of 5, the demographic groups most similar to Immigrants from Belize are Bangladeshi (20.6%, a difference of 0.050%), Central American (20.6%, a difference of 0.10%), West Indian (20.6%, a difference of 0.14%), Immigrants from West Indies (20.7%, a difference of 0.31%), and Immigrants from Grenada (20.7%, a difference of 0.33%).
| Demographics | Rating | Rank | Child Poverty Under the Age of 5 |
| Ottawa | 0.1 /100 | #267 | Tragic 20.3% |
| Belizeans | 0.1 /100 | #268 | Tragic 20.3% |
| Immigrants | Burma/Myanmar | 0.1 /100 | #269 | Tragic 20.4% |
| Jamaicans | 0.1 /100 | #270 | Tragic 20.4% |
| Americans | 0.1 /100 | #271 | Tragic 20.5% |
| Immigrants | Jamaica | 0.1 /100 | #272 | Tragic 20.5% |
| Central Americans | 0.1 /100 | #273 | Tragic 20.6% |
| Immigrants | Belize | 0.1 /100 | #274 | Tragic 20.6% |
| Bangladeshis | 0.1 /100 | #275 | Tragic 20.6% |
| West Indians | 0.0 /100 | #276 | Tragic 20.6% |
| Immigrants | West Indies | 0.0 /100 | #277 | Tragic 20.7% |
| Immigrants | Grenada | 0.0 /100 | #278 | Tragic 20.7% |
| Sub-Saharan Africans | 0.0 /100 | #279 | Tragic 20.8% |
| French American Indians | 0.0 /100 | #280 | Tragic 20.8% |
| Senegalese | 0.0 /100 | #281 | Tragic 20.9% |
Demographics Similar to Immigrants from Iraq by Child Poverty Under the Age of 5
In terms of child poverty under the age of 5, the demographic groups most similar to Immigrants from Iraq are Immigrants from Sierra Leone (17.3%, a difference of 0.16%), Immigrants from Lebanon (17.3%, a difference of 0.25%), Immigrants from Cameroon (17.4%, a difference of 0.26%), Hawaiian (17.4%, a difference of 0.39%), and South American Indian (17.4%, a difference of 0.40%).
| Demographics | Rating | Rank | Child Poverty Under the Age of 5 |
| Immigrants | South America | 60.0 /100 | #169 | Good 17.1% |
| Immigrants | Western Asia | 59.2 /100 | #170 | Average 17.1% |
| Immigrants | Morocco | 58.9 /100 | #171 | Average 17.1% |
| Yugoslavians | 54.1 /100 | #172 | Average 17.2% |
| Welsh | 54.0 /100 | #173 | Average 17.2% |
| Immigrants | Saudi Arabia | 50.0 /100 | #174 | Average 17.2% |
| Immigrants | Lebanon | 47.6 /100 | #175 | Average 17.3% |
| Immigrants | Iraq | 45.2 /100 | #176 | Average 17.3% |
| Immigrants | Sierra Leone | 43.6 /100 | #177 | Average 17.3% |
| Immigrants | Cameroon | 42.7 /100 | #178 | Average 17.4% |
| Hawaiians | 41.5 /100 | #179 | Average 17.4% |
| South American Indians | 41.4 /100 | #180 | Average 17.4% |
| Immigrants | Germany | 41.0 /100 | #181 | Average 17.4% |
| Arabs | 40.7 /100 | #182 | Average 17.4% |
| Lebanese | 40.3 /100 | #183 | Average 17.4% |