Cypriot vs Immigrants from Scotland Child Poverty Under the Age of 5
COMPARE
Cypriot
Immigrants from Scotland
Child Poverty Under the Age of 5
Child Poverty Under the Age of 5 Comparison
Cypriots
Immigrants from Scotland
14.0%
CHILD POVERTY UNDER THE AGE OF 5
99.9/ 100
METRIC RATING
25th/ 347
METRIC RANK
15.2%
CHILD POVERTY UNDER THE AGE OF 5
99.0/ 100
METRIC RATING
66th/ 347
METRIC RANK
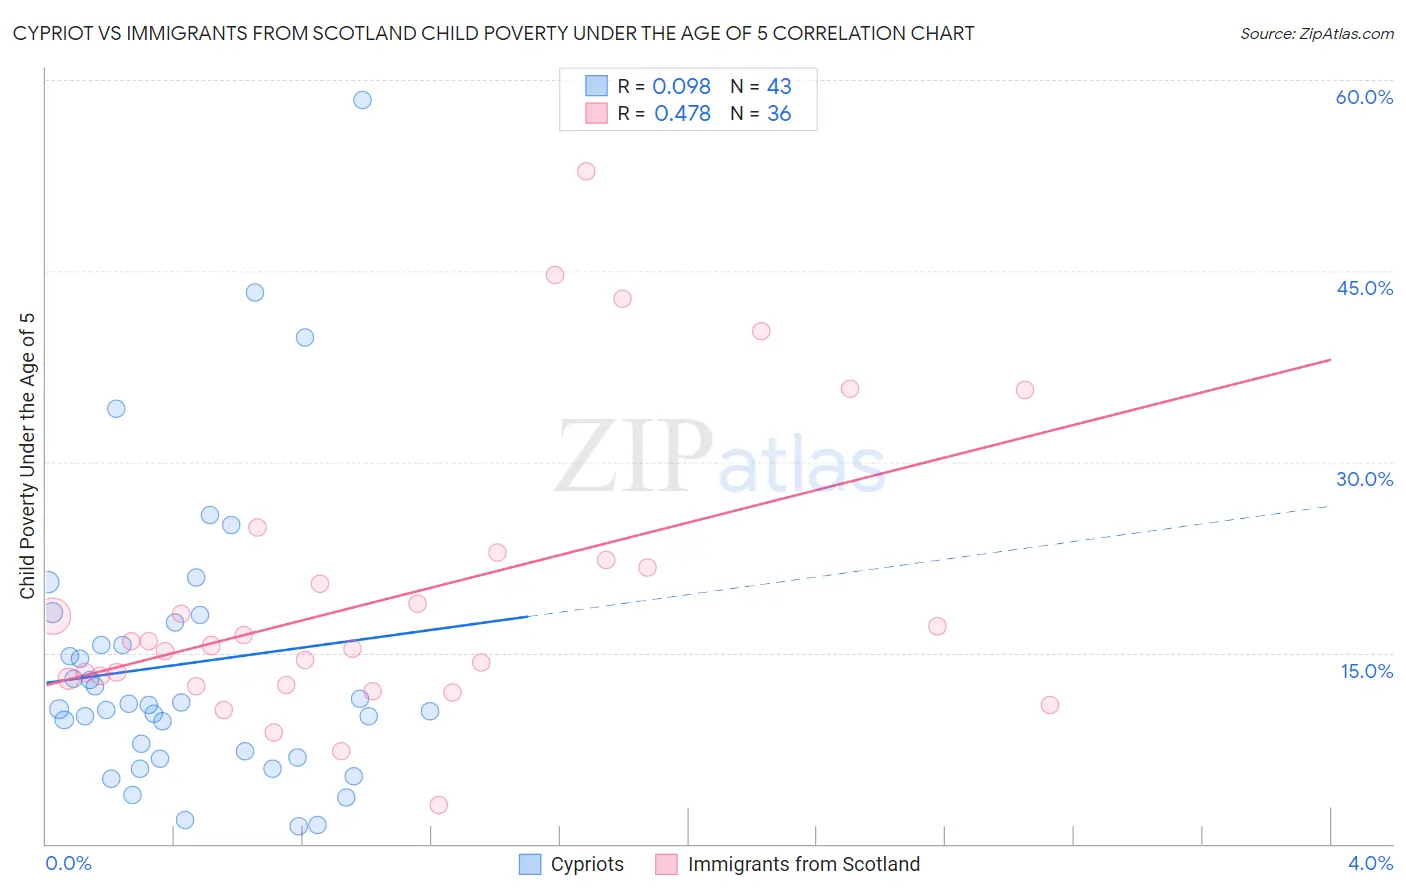
Cypriot vs Immigrants from Scotland Child Poverty Under the Age of 5 Correlation Chart
The statistical analysis conducted on geographies consisting of 60,873,789 people shows a slight positive correlation between the proportion of Cypriots and poverty level among children under the age of 5 in the United States with a correlation coefficient (R) of 0.098 and weighted average of 14.0%. Similarly, the statistical analysis conducted on geographies consisting of 190,045,386 people shows a moderate positive correlation between the proportion of Immigrants from Scotland and poverty level among children under the age of 5 in the United States with a correlation coefficient (R) of 0.478 and weighted average of 15.2%, a difference of 8.7%.
Child Poverty Under the Age of 5 Correlation Summary
| Measurement | Cypriot | Immigrants from Scotland |
| Minimum | 1.4% | 3.0% |
| Maximum | 58.4% | 52.8% |
| Range | 57.0% | 49.8% |
| Mean | 14.2% | 19.5% |
| Median | 10.9% | 15.7% |
| Interquartile 25% (IQ1) | 6.8% | 12.7% |
| Interquartile 75% (IQ3) | 17.4% | 22.0% |
| Interquartile Range (IQR) | 10.6% | 9.3% |
| Standard Deviation (Sample) | 11.6% | 11.4% |
| Standard Deviation (Population) | 11.4% | 11.2% |
Similar Demographics by Child Poverty Under the Age of 5
Demographics Similar to Cypriots by Child Poverty Under the Age of 5
In terms of child poverty under the age of 5, the demographic groups most similar to Cypriots are Asian (14.0%, a difference of 0.0%), Bulgarian (13.9%, a difference of 0.52%), Immigrants from Lithuania (14.1%, a difference of 0.93%), Immigrants from Bolivia (13.8%, a difference of 0.96%), and Bolivian (13.8%, a difference of 1.0%).
| Demographics | Rating | Rank | Child Poverty Under the Age of 5 |
| Immigrants | China | 100.0 /100 | #18 | Exceptional 13.6% |
| Immigrants | Ireland | 100.0 /100 | #19 | Exceptional 13.7% |
| Immigrants | Japan | 100.0 /100 | #20 | Exceptional 13.8% |
| Bolivians | 100.0 /100 | #21 | Exceptional 13.8% |
| Immigrants | Bolivia | 100.0 /100 | #22 | Exceptional 13.8% |
| Bulgarians | 99.9 /100 | #23 | Exceptional 13.9% |
| Asians | 99.9 /100 | #24 | Exceptional 14.0% |
| Cypriots | 99.9 /100 | #25 | Exceptional 14.0% |
| Immigrants | Lithuania | 99.9 /100 | #26 | Exceptional 14.1% |
| Tongans | 99.9 /100 | #27 | Exceptional 14.2% |
| Immigrants | Indonesia | 99.8 /100 | #28 | Exceptional 14.3% |
| Immigrants | Asia | 99.8 /100 | #29 | Exceptional 14.4% |
| Cambodians | 99.8 /100 | #30 | Exceptional 14.4% |
| Koreans | 99.8 /100 | #31 | Exceptional 14.4% |
| Immigrants | Sri Lanka | 99.8 /100 | #32 | Exceptional 14.4% |
Demographics Similar to Immigrants from Scotland by Child Poverty Under the Age of 5
In terms of child poverty under the age of 5, the demographic groups most similar to Immigrants from Scotland are Greek (15.2%, a difference of 0.060%), Zimbabwean (15.2%, a difference of 0.070%), Lithuanian (15.2%, a difference of 0.080%), Immigrants from Fiji (15.2%, a difference of 0.11%), and Immigrants from Romania (15.2%, a difference of 0.14%).
| Demographics | Rating | Rank | Child Poverty Under the Age of 5 |
| Paraguayans | 99.4 /100 | #59 | Exceptional 15.0% |
| Immigrants | Russia | 99.3 /100 | #60 | Exceptional 15.0% |
| Immigrants | Poland | 99.1 /100 | #61 | Exceptional 15.1% |
| Immigrants | Eastern Europe | 99.1 /100 | #62 | Exceptional 15.1% |
| Immigrants | Europe | 99.1 /100 | #63 | Exceptional 15.1% |
| Immigrants | Romania | 99.1 /100 | #64 | Exceptional 15.2% |
| Immigrants | Fiji | 99.0 /100 | #65 | Exceptional 15.2% |
| Immigrants | Scotland | 99.0 /100 | #66 | Exceptional 15.2% |
| Greeks | 99.0 /100 | #67 | Exceptional 15.2% |
| Zimbabweans | 99.0 /100 | #68 | Exceptional 15.2% |
| Lithuanians | 99.0 /100 | #69 | Exceptional 15.2% |
| Immigrants | Belgium | 98.8 /100 | #70 | Exceptional 15.3% |
| Immigrants | Egypt | 98.8 /100 | #71 | Exceptional 15.3% |
| Immigrants | Sweden | 98.8 /100 | #72 | Exceptional 15.3% |
| Immigrants | Ukraine | 98.7 /100 | #73 | Exceptional 15.3% |