Immigrants from Belize vs Immigrants from Ghana Child Poverty Under the Age of 5
COMPARE
Immigrants from Belize
Immigrants from Ghana
Child Poverty Under the Age of 5
Child Poverty Under the Age of 5 Comparison
Immigrants from Belize
Immigrants from Ghana
20.6%
CHILD POVERTY UNDER THE AGE OF 5
0.1/ 100
METRIC RATING
274th/ 347
METRIC RANK
19.6%
CHILD POVERTY UNDER THE AGE OF 5
0.5/ 100
METRIC RATING
244th/ 347
METRIC RANK
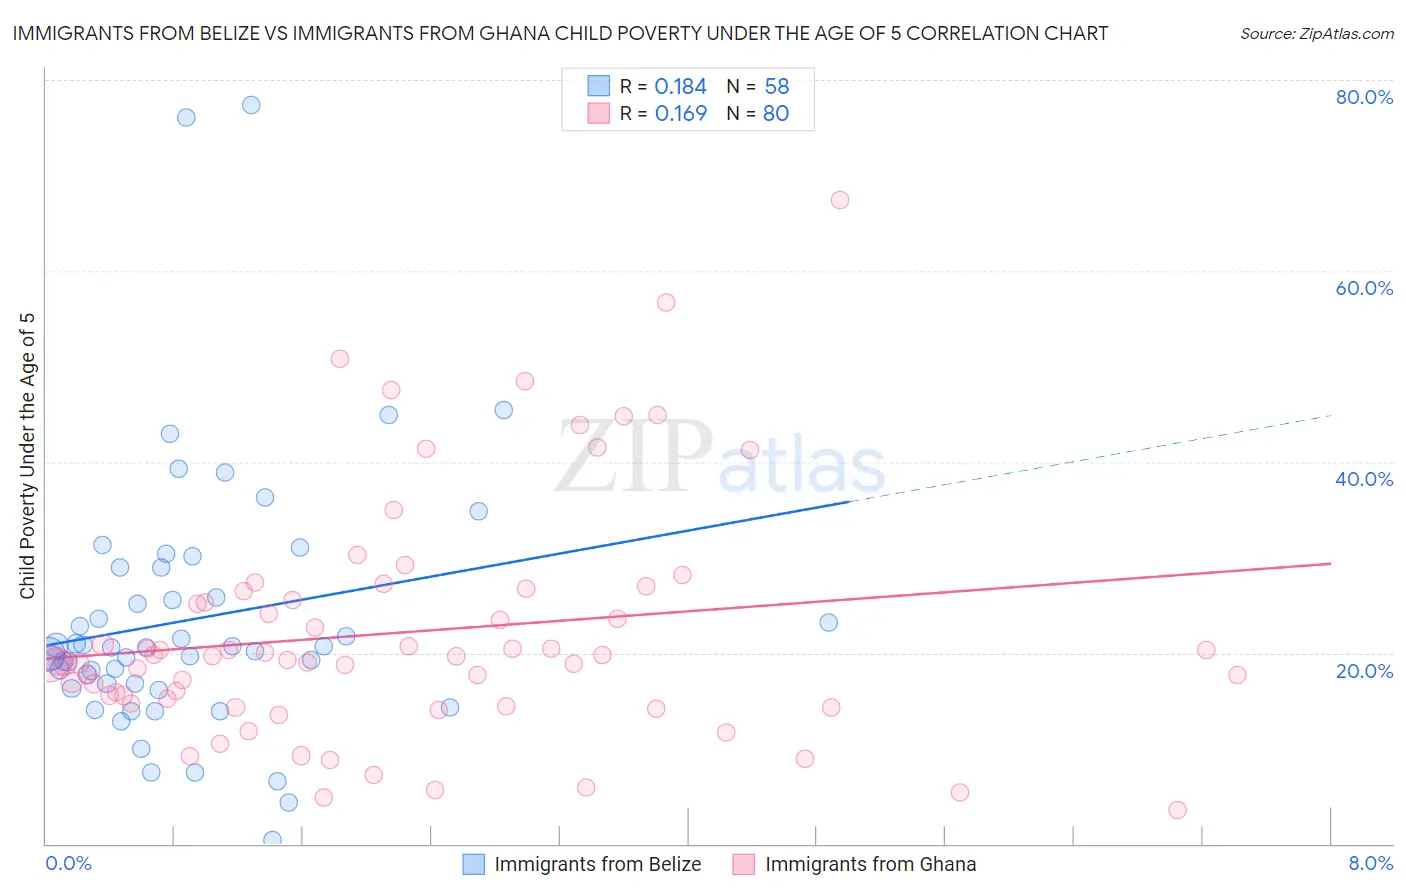
Immigrants from Belize vs Immigrants from Ghana Child Poverty Under the Age of 5 Correlation Chart
The statistical analysis conducted on geographies consisting of 129,008,475 people shows a poor positive correlation between the proportion of Immigrants from Belize and poverty level among children under the age of 5 in the United States with a correlation coefficient (R) of 0.184 and weighted average of 20.6%. Similarly, the statistical analysis conducted on geographies consisting of 196,214,024 people shows a poor positive correlation between the proportion of Immigrants from Ghana and poverty level among children under the age of 5 in the United States with a correlation coefficient (R) of 0.169 and weighted average of 19.6%, a difference of 4.9%.
Child Poverty Under the Age of 5 Correlation Summary
| Measurement | Immigrants from Belize | Immigrants from Ghana |
| Minimum | 0.34% | 3.5% |
| Maximum | 77.4% | 67.4% |
| Range | 77.1% | 63.9% |
| Mean | 23.5% | 22.1% |
| Median | 20.6% | 19.4% |
| Interquartile 25% (IQ1) | 16.8% | 14.9% |
| Interquartile 75% (IQ3) | 28.9% | 26.0% |
| Interquartile Range (IQR) | 12.1% | 11.1% |
| Standard Deviation (Sample) | 13.9% | 12.4% |
| Standard Deviation (Population) | 13.8% | 12.3% |
Similar Demographics by Child Poverty Under the Age of 5
Demographics Similar to Immigrants from Belize by Child Poverty Under the Age of 5
In terms of child poverty under the age of 5, the demographic groups most similar to Immigrants from Belize are Bangladeshi (20.6%, a difference of 0.050%), Central American (20.6%, a difference of 0.10%), West Indian (20.6%, a difference of 0.14%), Immigrants from West Indies (20.7%, a difference of 0.31%), and Immigrants from Grenada (20.7%, a difference of 0.33%).
| Demographics | Rating | Rank | Child Poverty Under the Age of 5 |
| Ottawa | 0.1 /100 | #267 | Tragic 20.3% |
| Belizeans | 0.1 /100 | #268 | Tragic 20.3% |
| Immigrants | Burma/Myanmar | 0.1 /100 | #269 | Tragic 20.4% |
| Jamaicans | 0.1 /100 | #270 | Tragic 20.4% |
| Americans | 0.1 /100 | #271 | Tragic 20.5% |
| Immigrants | Jamaica | 0.1 /100 | #272 | Tragic 20.5% |
| Central Americans | 0.1 /100 | #273 | Tragic 20.6% |
| Immigrants | Belize | 0.1 /100 | #274 | Tragic 20.6% |
| Bangladeshis | 0.1 /100 | #275 | Tragic 20.6% |
| West Indians | 0.0 /100 | #276 | Tragic 20.6% |
| Immigrants | West Indies | 0.0 /100 | #277 | Tragic 20.7% |
| Immigrants | Grenada | 0.0 /100 | #278 | Tragic 20.7% |
| Sub-Saharan Africans | 0.0 /100 | #279 | Tragic 20.8% |
| French American Indians | 0.0 /100 | #280 | Tragic 20.8% |
| Senegalese | 0.0 /100 | #281 | Tragic 20.9% |
Demographics Similar to Immigrants from Ghana by Child Poverty Under the Age of 5
In terms of child poverty under the age of 5, the demographic groups most similar to Immigrants from Ghana are Osage (19.6%, a difference of 0.020%), Immigrants from Guyana (19.6%, a difference of 0.12%), Immigrants from Western Africa (19.7%, a difference of 0.18%), Alaska Native (19.6%, a difference of 0.24%), and Cree (19.7%, a difference of 0.25%).
| Demographics | Rating | Rank | Child Poverty Under the Age of 5 |
| Immigrants | Cabo Verde | 0.6 /100 | #237 | Tragic 19.5% |
| Salvadorans | 0.6 /100 | #238 | Tragic 19.5% |
| Vietnamese | 0.6 /100 | #239 | Tragic 19.5% |
| Immigrants | Ecuador | 0.5 /100 | #240 | Tragic 19.6% |
| Alaska Natives | 0.5 /100 | #241 | Tragic 19.6% |
| Immigrants | Guyana | 0.5 /100 | #242 | Tragic 19.6% |
| Osage | 0.5 /100 | #243 | Tragic 19.6% |
| Immigrants | Ghana | 0.5 /100 | #244 | Tragic 19.6% |
| Immigrants | Western Africa | 0.4 /100 | #245 | Tragic 19.7% |
| Cree | 0.4 /100 | #246 | Tragic 19.7% |
| Guyanese | 0.4 /100 | #247 | Tragic 19.7% |
| Marshallese | 0.4 /100 | #248 | Tragic 19.7% |
| Immigrants | Middle Africa | 0.4 /100 | #249 | Tragic 19.7% |
| Immigrants | Nonimmigrants | 0.4 /100 | #250 | Tragic 19.7% |
| Pennsylvania Germans | 0.3 /100 | #251 | Tragic 19.8% |