Immigrants from Belgium vs Immigrants from Middle Africa Poverty
COMPARE
Immigrants from Belgium
Immigrants from Middle Africa
Poverty
Poverty Comparison
Immigrants from Belgium
Immigrants from Middle Africa
11.3%
POVERTY
97.2/ 100
METRIC RATING
73rd/ 347
METRIC RANK
14.0%
POVERTY
0.4/ 100
METRIC RATING
240th/ 347
METRIC RANK
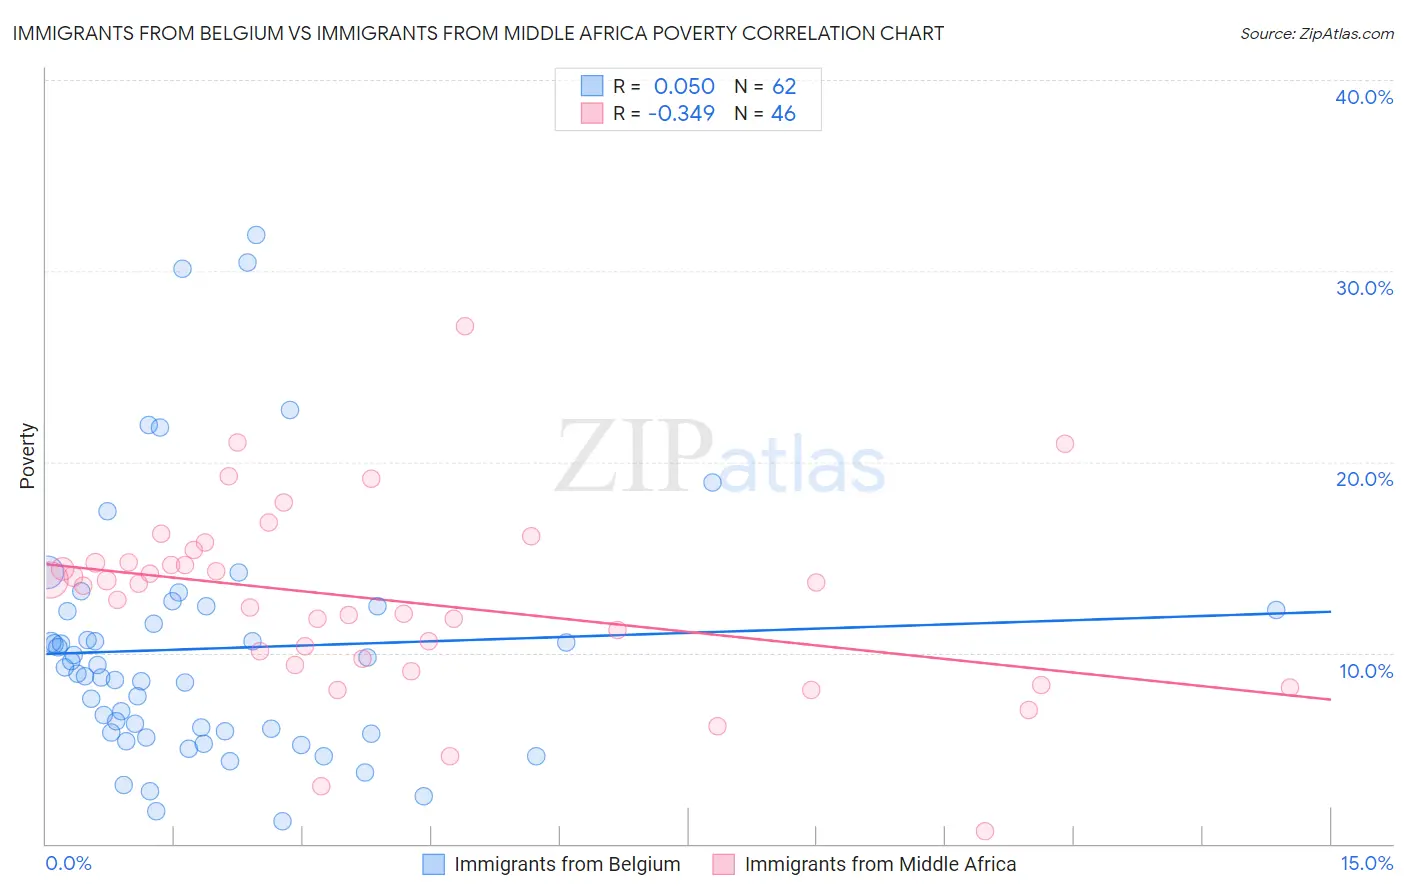
Immigrants from Belgium vs Immigrants from Middle Africa Poverty Correlation Chart
The statistical analysis conducted on geographies consisting of 146,699,020 people shows no correlation between the proportion of Immigrants from Belgium and poverty level in the United States with a correlation coefficient (R) of 0.050 and weighted average of 11.3%. Similarly, the statistical analysis conducted on geographies consisting of 202,643,852 people shows a mild negative correlation between the proportion of Immigrants from Middle Africa and poverty level in the United States with a correlation coefficient (R) of -0.349 and weighted average of 14.0%, a difference of 24.0%.
Poverty Correlation Summary
| Measurement | Immigrants from Belgium | Immigrants from Middle Africa |
| Minimum | 1.2% | 0.62% |
| Maximum | 31.9% | 27.1% |
| Range | 30.7% | 26.5% |
| Mean | 10.2% | 12.8% |
| Median | 9.1% | 13.6% |
| Interquartile 25% (IQ1) | 5.8% | 9.7% |
| Interquartile 75% (IQ3) | 12.3% | 14.7% |
| Interquartile Range (IQR) | 6.4% | 5.0% |
| Standard Deviation (Sample) | 6.6% | 4.9% |
| Standard Deviation (Population) | 6.6% | 4.8% |
Similar Demographics by Poverty
Demographics Similar to Immigrants from Belgium by Poverty
In terms of poverty, the demographic groups most similar to Immigrants from Belgium are European (11.3%, a difference of 0.0%), Zimbabwean (11.3%, a difference of 0.020%), Immigrants from Canada (11.3%, a difference of 0.040%), Carpatho Rusyn (11.3%, a difference of 0.050%), and Serbian (11.2%, a difference of 0.13%).
| Demographics | Rating | Rank | Poverty |
| Immigrants | Netherlands | 97.5 /100 | #66 | Exceptional 11.2% |
| Immigrants | Australia | 97.4 /100 | #67 | Exceptional 11.2% |
| Slovaks | 97.4 /100 | #68 | Exceptional 11.2% |
| Serbians | 97.4 /100 | #69 | Exceptional 11.2% |
| Immigrants | Canada | 97.3 /100 | #70 | Exceptional 11.3% |
| Zimbabweans | 97.3 /100 | #71 | Exceptional 11.3% |
| Europeans | 97.2 /100 | #72 | Exceptional 11.3% |
| Immigrants | Belgium | 97.2 /100 | #73 | Exceptional 11.3% |
| Carpatho Rusyns | 97.2 /100 | #74 | Exceptional 11.3% |
| Immigrants | Eastern Europe | 97.0 /100 | #75 | Exceptional 11.3% |
| Immigrants | North America | 96.8 /100 | #76 | Exceptional 11.3% |
| Immigrants | Eastern Asia | 96.7 /100 | #77 | Exceptional 11.3% |
| Dutch | 96.7 /100 | #78 | Exceptional 11.3% |
| Cambodians | 96.7 /100 | #79 | Exceptional 11.3% |
| Indians (Asian) | 96.6 /100 | #80 | Exceptional 11.3% |
Demographics Similar to Immigrants from Middle Africa by Poverty
In terms of poverty, the demographic groups most similar to Immigrants from Middle Africa are Salvadoran (14.0%, a difference of 0.020%), Nicaraguan (13.9%, a difference of 0.12%), Ecuadorian (14.0%, a difference of 0.34%), Sudanese (14.0%, a difference of 0.41%), and Nepalese (14.0%, a difference of 0.44%).
| Demographics | Rating | Rank | Poverty |
| Immigrants | Saudi Arabia | 0.8 /100 | #233 | Tragic 13.8% |
| Immigrants | Laos | 0.7 /100 | #234 | Tragic 13.8% |
| Cubans | 0.6 /100 | #235 | Tragic 13.9% |
| Immigrants | Armenia | 0.5 /100 | #236 | Tragic 13.9% |
| French American Indians | 0.5 /100 | #237 | Tragic 13.9% |
| Ghanaians | 0.5 /100 | #238 | Tragic 13.9% |
| Nicaraguans | 0.4 /100 | #239 | Tragic 13.9% |
| Immigrants | Middle Africa | 0.4 /100 | #240 | Tragic 14.0% |
| Salvadorans | 0.4 /100 | #241 | Tragic 14.0% |
| Ecuadorians | 0.4 /100 | #242 | Tragic 14.0% |
| Sudanese | 0.3 /100 | #243 | Tragic 14.0% |
| Nepalese | 0.3 /100 | #244 | Tragic 14.0% |
| Immigrants | Sudan | 0.3 /100 | #245 | Tragic 14.1% |
| Potawatomi | 0.3 /100 | #246 | Tragic 14.1% |
| Liberians | 0.2 /100 | #247 | Tragic 14.1% |