Immigrants from Belgium vs Immigrants from Brazil Householder Income Under 25 years
COMPARE
Immigrants from Belgium
Immigrants from Brazil
Householder Income Under 25 years
Householder Income Under 25 years Comparison
Immigrants from Belgium
Immigrants from Brazil
$54,830
HOUSEHOLDER INCOME UNDER 25 YEARS
99.8/ 100
METRIC RATING
63rd/ 347
METRIC RANK
$54,487
HOUSEHOLDER INCOME UNDER 25 YEARS
99.6/ 100
METRIC RATING
76th/ 347
METRIC RANK
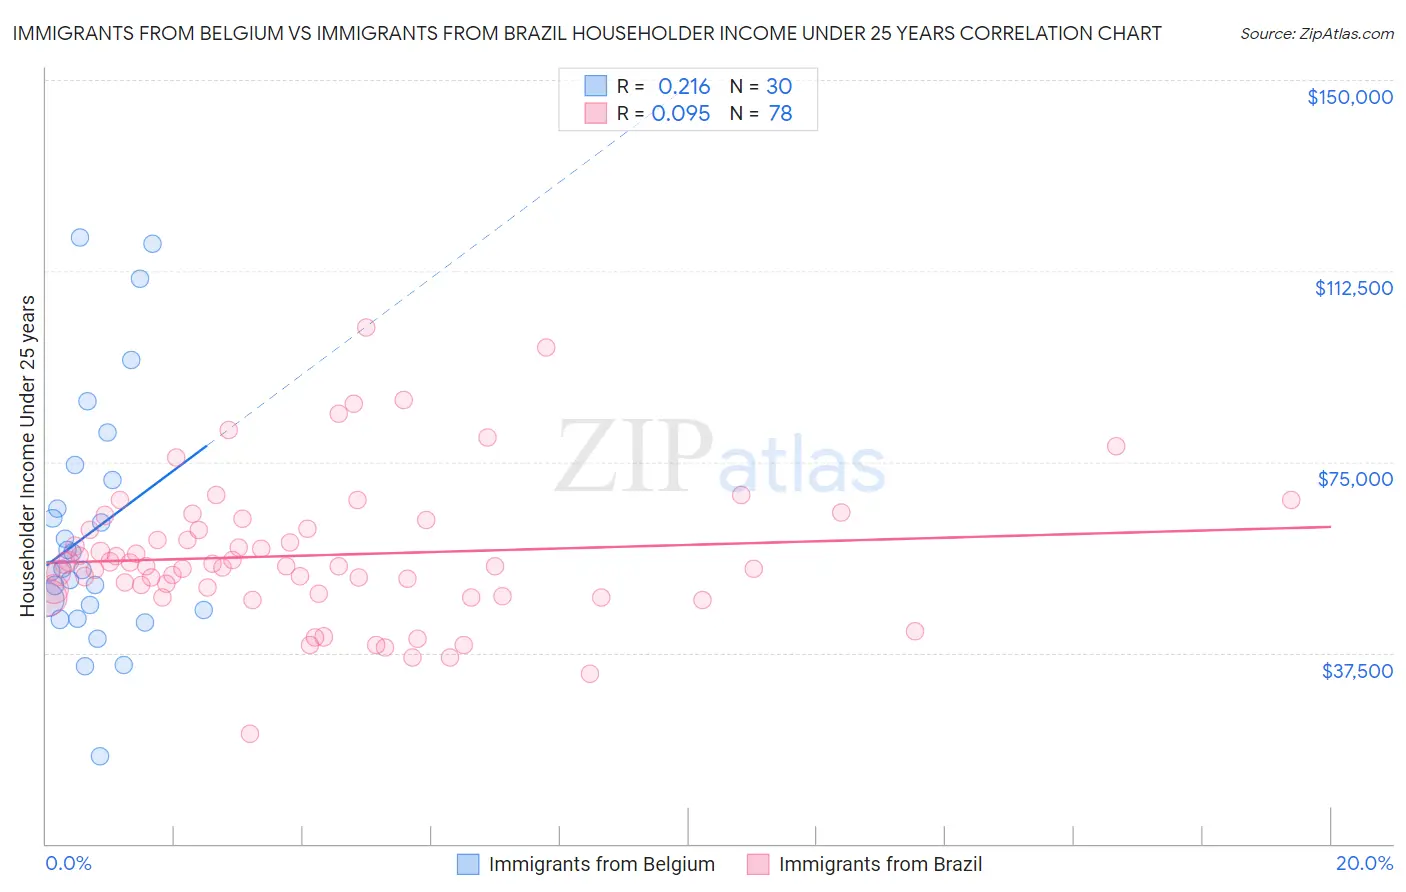
Immigrants from Belgium vs Immigrants from Brazil Householder Income Under 25 years Correlation Chart
The statistical analysis conducted on geographies consisting of 131,972,517 people shows a weak positive correlation between the proportion of Immigrants from Belgium and household income with householder under the age of 25 in the United States with a correlation coefficient (R) of 0.216 and weighted average of $54,830. Similarly, the statistical analysis conducted on geographies consisting of 290,809,322 people shows a slight positive correlation between the proportion of Immigrants from Brazil and household income with householder under the age of 25 in the United States with a correlation coefficient (R) of 0.095 and weighted average of $54,487, a difference of 0.63%.
Householder Income Under 25 years Correlation Summary
| Measurement | Immigrants from Belgium | Immigrants from Brazil |
| Minimum | $17,103 | $21,618 |
| Maximum | $119,035 | $101,440 |
| Range | $101,933 | $79,822 |
| Mean | $61,275 | $56,652 |
| Median | $53,928 | $54,576 |
| Interquartile 25% (IQ1) | $46,000 | $49,112 |
| Interquartile 75% (IQ3) | $71,485 | $61,875 |
| Interquartile Range (IQR) | $25,485 | $12,763 |
| Standard Deviation (Sample) | $24,412 | $13,948 |
| Standard Deviation (Population) | $24,002 | $13,859 |
Demographics Similar to Immigrants from Belgium and Immigrants from Brazil by Householder Income Under 25 years
In terms of householder income under 25 years, the demographic groups most similar to Immigrants from Belgium are Immigrants from Uzbekistan ($54,846, a difference of 0.030%), Burmese ($54,800, a difference of 0.060%), Yup'ik ($54,732, a difference of 0.18%), Immigrants from Bangladesh ($54,714, a difference of 0.21%), and Okinawan ($54,701, a difference of 0.24%). Similarly, the demographic groups most similar to Immigrants from Brazil are Immigrants from Southern Europe ($54,484, a difference of 0.010%), Nepalese ($54,472, a difference of 0.030%), Immigrants from Sri Lanka ($54,512, a difference of 0.050%), Immigrants from Italy ($54,449, a difference of 0.070%), and Immigrants from Grenada ($54,538, a difference of 0.090%).
| Demographics | Rating | Rank | Householder Income Under 25 years |
| Native Hawaiians | 99.9 /100 | #59 | Exceptional $55,158 |
| Immigrants | Lithuania | 99.9 /100 | #60 | Exceptional $55,028 |
| Immigrants | Europe | 99.9 /100 | #61 | Exceptional $55,022 |
| Immigrants | Uzbekistan | 99.8 /100 | #62 | Exceptional $54,846 |
| Immigrants | Belgium | 99.8 /100 | #63 | Exceptional $54,830 |
| Burmese | 99.8 /100 | #64 | Exceptional $54,800 |
| Yup'ik | 99.8 /100 | #65 | Exceptional $54,732 |
| Immigrants | Bangladesh | 99.8 /100 | #66 | Exceptional $54,714 |
| Okinawans | 99.8 /100 | #67 | Exceptional $54,701 |
| Tsimshian | 99.8 /100 | #68 | Exceptional $54,649 |
| Samoans | 99.7 /100 | #69 | Exceptional $54,610 |
| Immigrants | El Salvador | 99.7 /100 | #70 | Exceptional $54,599 |
| Immigrants | Morocco | 99.7 /100 | #71 | Exceptional $54,593 |
| Immigrants | Northern Europe | 99.7 /100 | #72 | Exceptional $54,571 |
| Macedonians | 99.7 /100 | #73 | Exceptional $54,563 |
| Immigrants | Grenada | 99.7 /100 | #74 | Exceptional $54,538 |
| Immigrants | Sri Lanka | 99.7 /100 | #75 | Exceptional $54,512 |
| Immigrants | Brazil | 99.6 /100 | #76 | Exceptional $54,487 |
| Immigrants | Southern Europe | 99.6 /100 | #77 | Exceptional $54,484 |
| Nepalese | 99.6 /100 | #78 | Exceptional $54,472 |
| Immigrants | Italy | 99.6 /100 | #79 | Exceptional $54,449 |