Immigrants from Belarus vs Laotian Disability
COMPARE
Immigrants from Belarus
Laotian
Disability
Disability Comparison
Immigrants from Belarus
Laotians
11.1%
DISABILITY
98.9/ 100
METRIC RATING
85th/ 347
METRIC RANK
11.0%
DISABILITY
99.6/ 100
METRIC RATING
66th/ 347
METRIC RANK
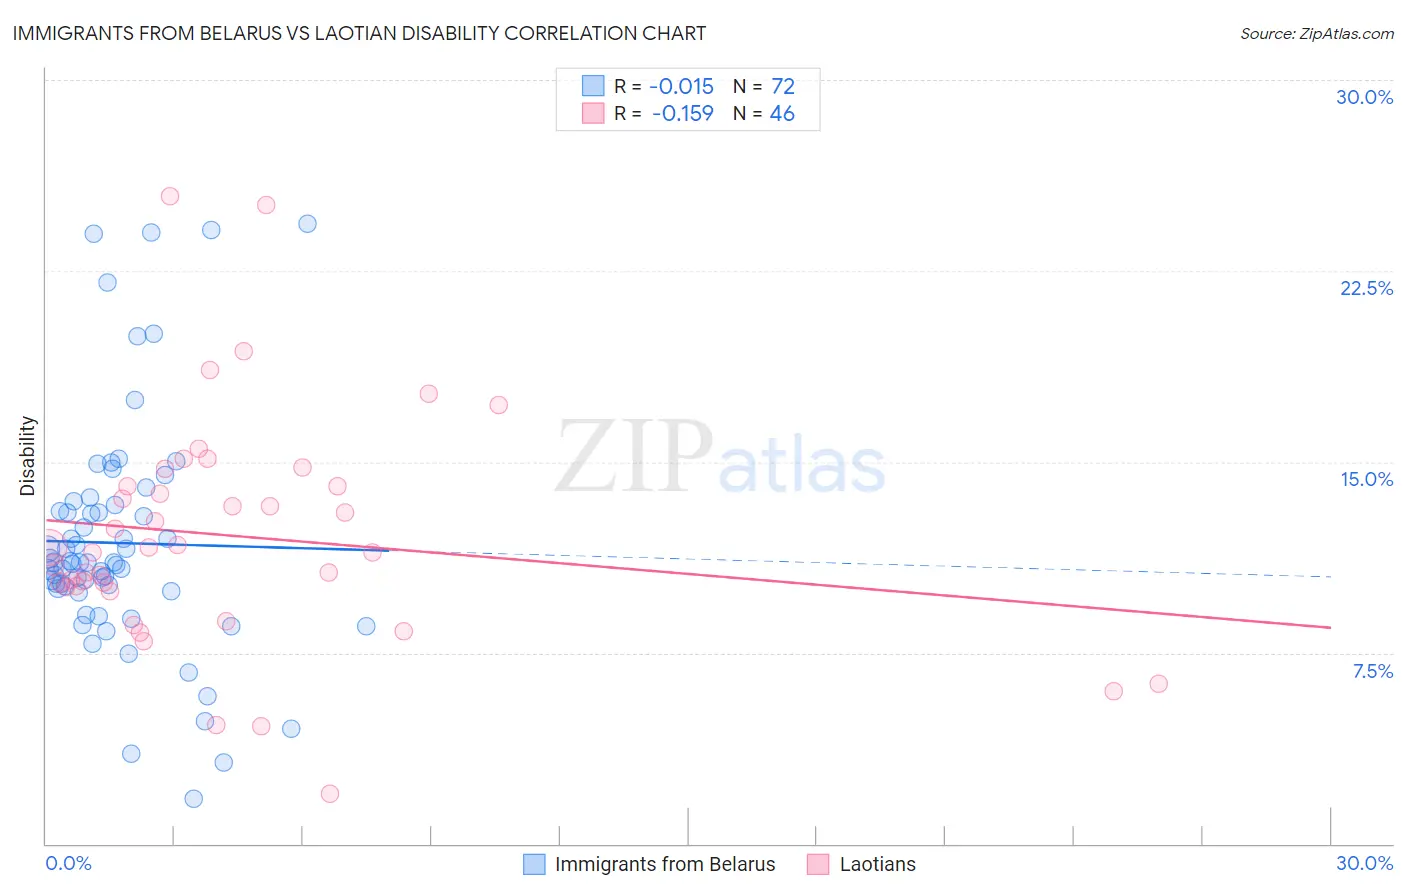
Immigrants from Belarus vs Laotian Disability Correlation Chart
The statistical analysis conducted on geographies consisting of 150,193,731 people shows no correlation between the proportion of Immigrants from Belarus and percentage of population with a disability in the United States with a correlation coefficient (R) of -0.015 and weighted average of 11.1%. Similarly, the statistical analysis conducted on geographies consisting of 224,855,806 people shows a poor negative correlation between the proportion of Laotians and percentage of population with a disability in the United States with a correlation coefficient (R) of -0.159 and weighted average of 11.0%, a difference of 1.3%.
Disability Correlation Summary
| Measurement | Immigrants from Belarus | Laotian |
| Minimum | 1.8% | 2.0% |
| Maximum | 24.3% | 25.4% |
| Range | 22.6% | 23.5% |
| Mean | 11.8% | 12.1% |
| Median | 11.0% | 11.6% |
| Interquartile 25% (IQ1) | 10.0% | 10.1% |
| Interquartile 75% (IQ3) | 13.2% | 14.1% |
| Interquartile Range (IQR) | 3.2% | 4.0% |
| Standard Deviation (Sample) | 4.6% | 4.6% |
| Standard Deviation (Population) | 4.6% | 4.5% |
Demographics Similar to Immigrants from Belarus and Laotians by Disability
In terms of disability, the demographic groups most similar to Immigrants from Belarus are Immigrants from Sierra Leone (11.1%, a difference of 0.15%), Immigrants from Switzerland (11.1%, a difference of 0.16%), Chilean (11.1%, a difference of 0.19%), Immigrants from Poland (11.1%, a difference of 0.24%), and Immigrants from Ireland (11.1%, a difference of 0.49%). Similarly, the demographic groups most similar to Laotians are Bulgarian (11.0%, a difference of 0.010%), Colombian (11.0%, a difference of 0.080%), Immigrants from Afghanistan (11.0%, a difference of 0.20%), Sri Lankan (11.0%, a difference of 0.42%), and Immigrants from France (11.0%, a difference of 0.49%).
| Demographics | Rating | Rank | Disability |
| Bulgarians | 99.6 /100 | #65 | Exceptional 11.0% |
| Laotians | 99.6 /100 | #66 | Exceptional 11.0% |
| Colombians | 99.6 /100 | #67 | Exceptional 11.0% |
| Immigrants | Afghanistan | 99.6 /100 | #68 | Exceptional 11.0% |
| Sri Lankans | 99.5 /100 | #69 | Exceptional 11.0% |
| Immigrants | France | 99.4 /100 | #70 | Exceptional 11.0% |
| Immigrants | Lebanon | 99.4 /100 | #71 | Exceptional 11.0% |
| Immigrants | Chile | 99.4 /100 | #72 | Exceptional 11.0% |
| Immigrants | Bangladesh | 99.4 /100 | #73 | Exceptional 11.0% |
| Immigrants | Serbia | 99.4 /100 | #74 | Exceptional 11.0% |
| Immigrants | Vietnam | 99.4 /100 | #75 | Exceptional 11.0% |
| Sierra Leoneans | 99.3 /100 | #76 | Exceptional 11.0% |
| Immigrants | Belgium | 99.3 /100 | #77 | Exceptional 11.0% |
| Immigrants | Cameroon | 99.3 /100 | #78 | Exceptional 11.1% |
| Immigrants | Jordan | 99.3 /100 | #79 | Exceptional 11.1% |
| Immigrants | Ireland | 99.3 /100 | #80 | Exceptional 11.1% |
| Immigrants | Poland | 99.1 /100 | #81 | Exceptional 11.1% |
| Chileans | 99.1 /100 | #82 | Exceptional 11.1% |
| Immigrants | Switzerland | 99.0 /100 | #83 | Exceptional 11.1% |
| Immigrants | Sierra Leone | 99.0 /100 | #84 | Exceptional 11.1% |
| Immigrants | Belarus | 98.9 /100 | #85 | Exceptional 11.1% |