Immigrants from Barbados vs Swedish Child Poverty Under the Age of 5
COMPARE
Immigrants from Barbados
Swedish
Child Poverty Under the Age of 5
Child Poverty Under the Age of 5 Comparison
Immigrants from Barbados
Swedes
20.0%
CHILD POVERTY UNDER THE AGE OF 5
0.2/ 100
METRIC RATING
256th/ 347
METRIC RANK
15.0%
CHILD POVERTY UNDER THE AGE OF 5
99.4/ 100
METRIC RATING
58th/ 347
METRIC RANK
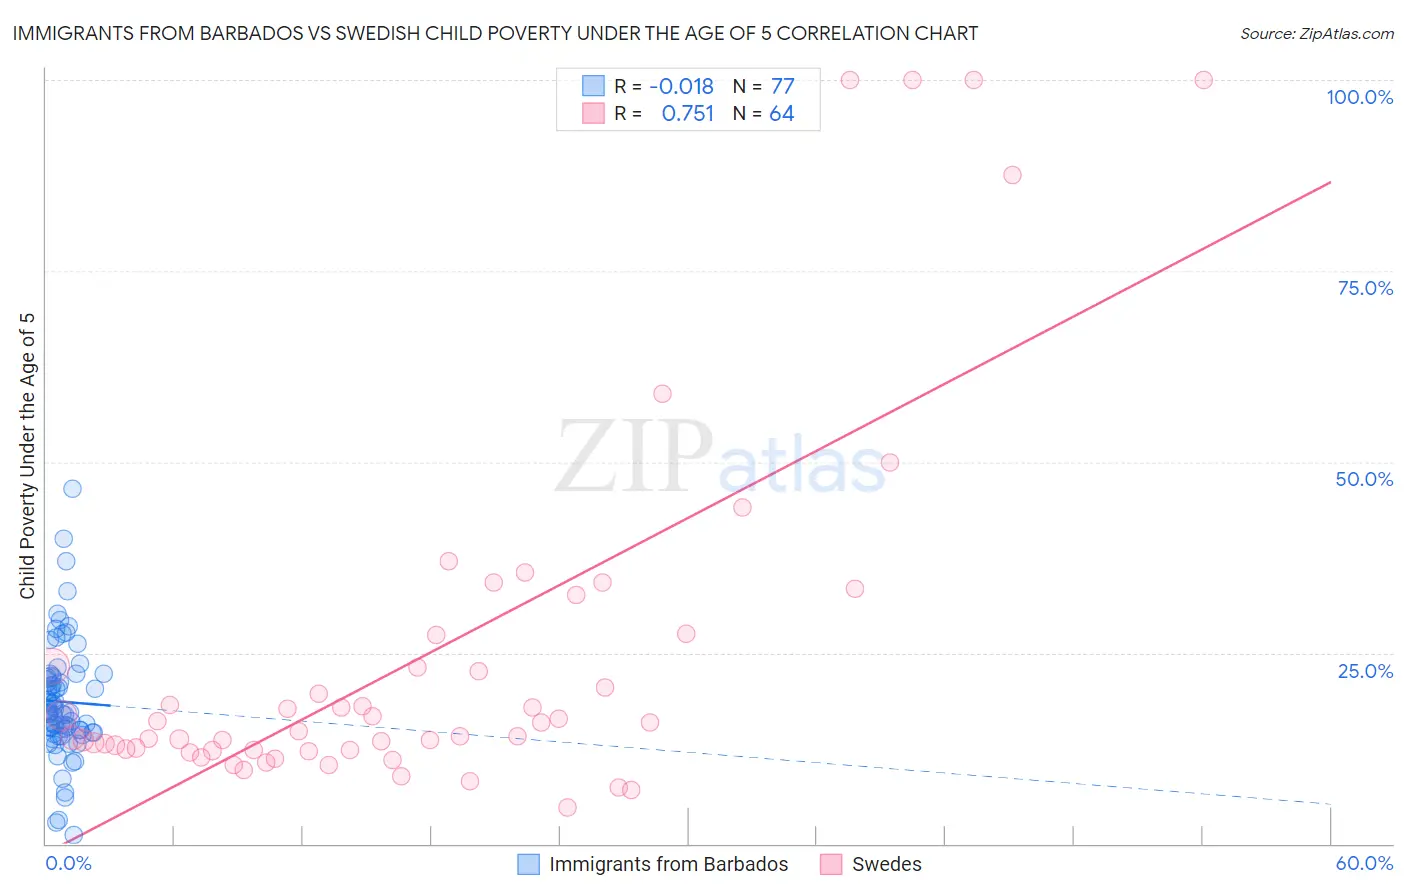
Immigrants from Barbados vs Swedish Child Poverty Under the Age of 5 Correlation Chart
The statistical analysis conducted on geographies consisting of 111,157,881 people shows no correlation between the proportion of Immigrants from Barbados and poverty level among children under the age of 5 in the United States with a correlation coefficient (R) of -0.018 and weighted average of 20.0%. Similarly, the statistical analysis conducted on geographies consisting of 502,877,472 people shows a strong positive correlation between the proportion of Swedes and poverty level among children under the age of 5 in the United States with a correlation coefficient (R) of 0.751 and weighted average of 15.0%, a difference of 33.5%.
Child Poverty Under the Age of 5 Correlation Summary
| Measurement | Immigrants from Barbados | Swedish |
| Minimum | 1.1% | 4.8% |
| Maximum | 46.4% | 100.0% |
| Range | 45.3% | 95.2% |
| Mean | 18.6% | 24.6% |
| Median | 17.1% | 15.2% |
| Interquartile 25% (IQ1) | 14.5% | 12.3% |
| Interquartile 75% (IQ3) | 21.9% | 25.3% |
| Interquartile Range (IQR) | 7.4% | 13.0% |
| Standard Deviation (Sample) | 7.7% | 23.8% |
| Standard Deviation (Population) | 7.6% | 23.6% |
Similar Demographics by Child Poverty Under the Age of 5
Demographics Similar to Immigrants from Barbados by Child Poverty Under the Age of 5
In terms of child poverty under the age of 5, the demographic groups most similar to Immigrants from Barbados are Shoshone (20.0%, a difference of 0.010%), Immigrants from St. Vincent and the Grenadines (20.0%, a difference of 0.15%), Immigrants from El Salvador (20.0%, a difference of 0.17%), Immigrants from Cuba (19.9%, a difference of 0.22%), and Fijian (19.9%, a difference of 0.32%).
| Demographics | Rating | Rank | Child Poverty Under the Age of 5 |
| Immigrants | Middle Africa | 0.4 /100 | #249 | Tragic 19.7% |
| Immigrants | Nonimmigrants | 0.4 /100 | #250 | Tragic 19.7% |
| Pennsylvania Germans | 0.3 /100 | #251 | Tragic 19.8% |
| Immigrants | Nicaragua | 0.3 /100 | #252 | Tragic 19.8% |
| Mexican American Indians | 0.3 /100 | #253 | Tragic 19.9% |
| Fijians | 0.3 /100 | #254 | Tragic 19.9% |
| Immigrants | Cuba | 0.2 /100 | #255 | Tragic 19.9% |
| Immigrants | Barbados | 0.2 /100 | #256 | Tragic 20.0% |
| Shoshone | 0.2 /100 | #257 | Tragic 20.0% |
| Immigrants | St. Vincent and the Grenadines | 0.2 /100 | #258 | Tragic 20.0% |
| Immigrants | El Salvador | 0.2 /100 | #259 | Tragic 20.0% |
| Spanish Americans | 0.2 /100 | #260 | Tragic 20.1% |
| Immigrants | Bangladesh | 0.2 /100 | #261 | Tragic 20.1% |
| Liberians | 0.1 /100 | #262 | Tragic 20.2% |
| Barbadians | 0.1 /100 | #263 | Tragic 20.2% |
Demographics Similar to Swedes by Child Poverty Under the Age of 5
In terms of child poverty under the age of 5, the demographic groups most similar to Swedes are Egyptian (14.9%, a difference of 0.050%), Immigrants from Pakistan (14.9%, a difference of 0.13%), Paraguayan (15.0%, a difference of 0.15%), Danish (14.9%, a difference of 0.20%), and Immigrants from Russia (15.0%, a difference of 0.24%).
| Demographics | Rating | Rank | Child Poverty Under the Age of 5 |
| Estonians | 99.6 /100 | #51 | Exceptional 14.8% |
| Immigrants | Serbia | 99.5 /100 | #52 | Exceptional 14.9% |
| Luxembourgers | 99.4 /100 | #53 | Exceptional 14.9% |
| Immigrants | Israel | 99.4 /100 | #54 | Exceptional 14.9% |
| Danes | 99.4 /100 | #55 | Exceptional 14.9% |
| Immigrants | Pakistan | 99.4 /100 | #56 | Exceptional 14.9% |
| Egyptians | 99.4 /100 | #57 | Exceptional 14.9% |
| Swedes | 99.4 /100 | #58 | Exceptional 15.0% |
| Paraguayans | 99.4 /100 | #59 | Exceptional 15.0% |
| Immigrants | Russia | 99.3 /100 | #60 | Exceptional 15.0% |
| Immigrants | Poland | 99.1 /100 | #61 | Exceptional 15.1% |
| Immigrants | Eastern Europe | 99.1 /100 | #62 | Exceptional 15.1% |
| Immigrants | Europe | 99.1 /100 | #63 | Exceptional 15.1% |
| Immigrants | Romania | 99.1 /100 | #64 | Exceptional 15.2% |
| Immigrants | Fiji | 99.0 /100 | #65 | Exceptional 15.2% |