Immigrants from Germany vs Immigrants from Ecuador Child Poverty Under the Age of 5
COMPARE
Immigrants from Germany
Immigrants from Ecuador
Child Poverty Under the Age of 5
Child Poverty Under the Age of 5 Comparison
Immigrants from Germany
Immigrants from Ecuador
17.4%
CHILD POVERTY UNDER THE AGE OF 5
41.0/ 100
METRIC RATING
181st/ 347
METRIC RANK
19.6%
CHILD POVERTY UNDER THE AGE OF 5
0.5/ 100
METRIC RATING
240th/ 347
METRIC RANK
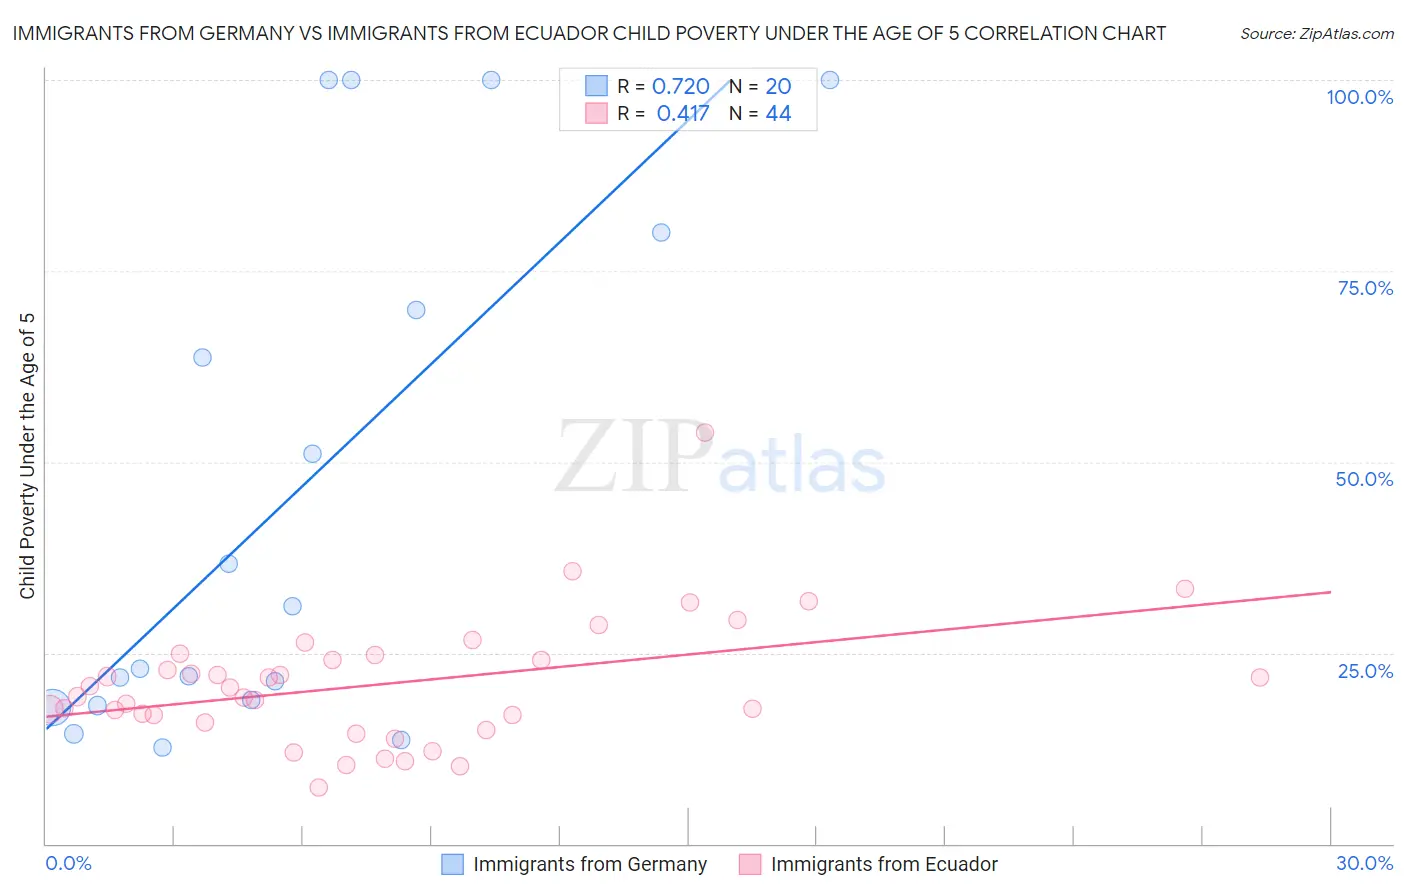
Immigrants from Germany vs Immigrants from Ecuador Child Poverty Under the Age of 5 Correlation Chart
The statistical analysis conducted on geographies consisting of 440,983,234 people shows a strong positive correlation between the proportion of Immigrants from Germany and poverty level among children under the age of 5 in the United States with a correlation coefficient (R) of 0.720 and weighted average of 17.4%. Similarly, the statistical analysis conducted on geographies consisting of 262,656,559 people shows a moderate positive correlation between the proportion of Immigrants from Ecuador and poverty level among children under the age of 5 in the United States with a correlation coefficient (R) of 0.417 and weighted average of 19.6%, a difference of 12.6%.
Child Poverty Under the Age of 5 Correlation Summary
| Measurement | Immigrants from Germany | Immigrants from Ecuador |
| Minimum | 12.7% | 7.3% |
| Maximum | 100.0% | 53.9% |
| Range | 87.3% | 46.6% |
| Mean | 45.8% | 20.9% |
| Median | 27.0% | 19.9% |
| Interquartile 25% (IQ1) | 18.5% | 16.4% |
| Interquartile 75% (IQ3) | 74.9% | 24.4% |
| Interquartile Range (IQR) | 56.4% | 8.0% |
| Standard Deviation (Sample) | 33.9% | 8.3% |
| Standard Deviation (Population) | 33.0% | 8.2% |
Similar Demographics by Child Poverty Under the Age of 5
Demographics Similar to Immigrants from Germany by Child Poverty Under the Age of 5
In terms of child poverty under the age of 5, the demographic groups most similar to Immigrants from Germany are Arab (17.4%, a difference of 0.030%), Hawaiian (17.4%, a difference of 0.050%), South American Indian (17.4%, a difference of 0.050%), Lebanese (17.4%, a difference of 0.070%), and Immigrants from Cameroon (17.4%, a difference of 0.18%).
| Demographics | Rating | Rank | Child Poverty Under the Age of 5 |
| Immigrants | Saudi Arabia | 50.0 /100 | #174 | Average 17.2% |
| Immigrants | Lebanon | 47.6 /100 | #175 | Average 17.3% |
| Immigrants | Iraq | 45.2 /100 | #176 | Average 17.3% |
| Immigrants | Sierra Leone | 43.6 /100 | #177 | Average 17.3% |
| Immigrants | Cameroon | 42.7 /100 | #178 | Average 17.4% |
| Hawaiians | 41.5 /100 | #179 | Average 17.4% |
| South American Indians | 41.4 /100 | #180 | Average 17.4% |
| Immigrants | Germany | 41.0 /100 | #181 | Average 17.4% |
| Arabs | 40.7 /100 | #182 | Average 17.4% |
| Lebanese | 40.3 /100 | #183 | Average 17.4% |
| Immigrants | Costa Rica | 39.0 /100 | #184 | Fair 17.4% |
| Immigrants | Armenia | 38.0 /100 | #185 | Fair 17.5% |
| Immigrants | Bosnia and Herzegovina | 35.0 /100 | #186 | Fair 17.5% |
| Kenyans | 34.7 /100 | #187 | Fair 17.5% |
| Carpatho Rusyns | 33.6 /100 | #188 | Fair 17.5% |
Demographics Similar to Immigrants from Ecuador by Child Poverty Under the Age of 5
In terms of child poverty under the age of 5, the demographic groups most similar to Immigrants from Ecuador are Alaska Native (19.6%, a difference of 0.060%), Immigrants from Guyana (19.6%, a difference of 0.18%), Osage (19.6%, a difference of 0.28%), Immigrants from Ghana (19.6%, a difference of 0.30%), and Vietnamese (19.5%, a difference of 0.37%).
| Demographics | Rating | Rank | Child Poverty Under the Age of 5 |
| Sudanese | 0.9 /100 | #233 | Tragic 19.3% |
| Immigrants | Micronesia | 0.9 /100 | #234 | Tragic 19.4% |
| Immigrants | Laos | 0.8 /100 | #235 | Tragic 19.4% |
| Immigrants | Trinidad and Tobago | 0.8 /100 | #236 | Tragic 19.4% |
| Immigrants | Cabo Verde | 0.6 /100 | #237 | Tragic 19.5% |
| Salvadorans | 0.6 /100 | #238 | Tragic 19.5% |
| Vietnamese | 0.6 /100 | #239 | Tragic 19.5% |
| Immigrants | Ecuador | 0.5 /100 | #240 | Tragic 19.6% |
| Alaska Natives | 0.5 /100 | #241 | Tragic 19.6% |
| Immigrants | Guyana | 0.5 /100 | #242 | Tragic 19.6% |
| Osage | 0.5 /100 | #243 | Tragic 19.6% |
| Immigrants | Ghana | 0.5 /100 | #244 | Tragic 19.6% |
| Immigrants | Western Africa | 0.4 /100 | #245 | Tragic 19.7% |
| Cree | 0.4 /100 | #246 | Tragic 19.7% |
| Guyanese | 0.4 /100 | #247 | Tragic 19.7% |