Immigrants from Barbados vs Immigrants from Afghanistan Child Poverty Under the Age of 5
COMPARE
Immigrants from Barbados
Immigrants from Afghanistan
Child Poverty Under the Age of 5
Child Poverty Under the Age of 5 Comparison
Immigrants from Barbados
Immigrants from Afghanistan
20.0%
CHILD POVERTY UNDER THE AGE OF 5
0.2/ 100
METRIC RATING
256th/ 347
METRIC RANK
17.7%
CHILD POVERTY UNDER THE AGE OF 5
27.9/ 100
METRIC RATING
191st/ 347
METRIC RANK
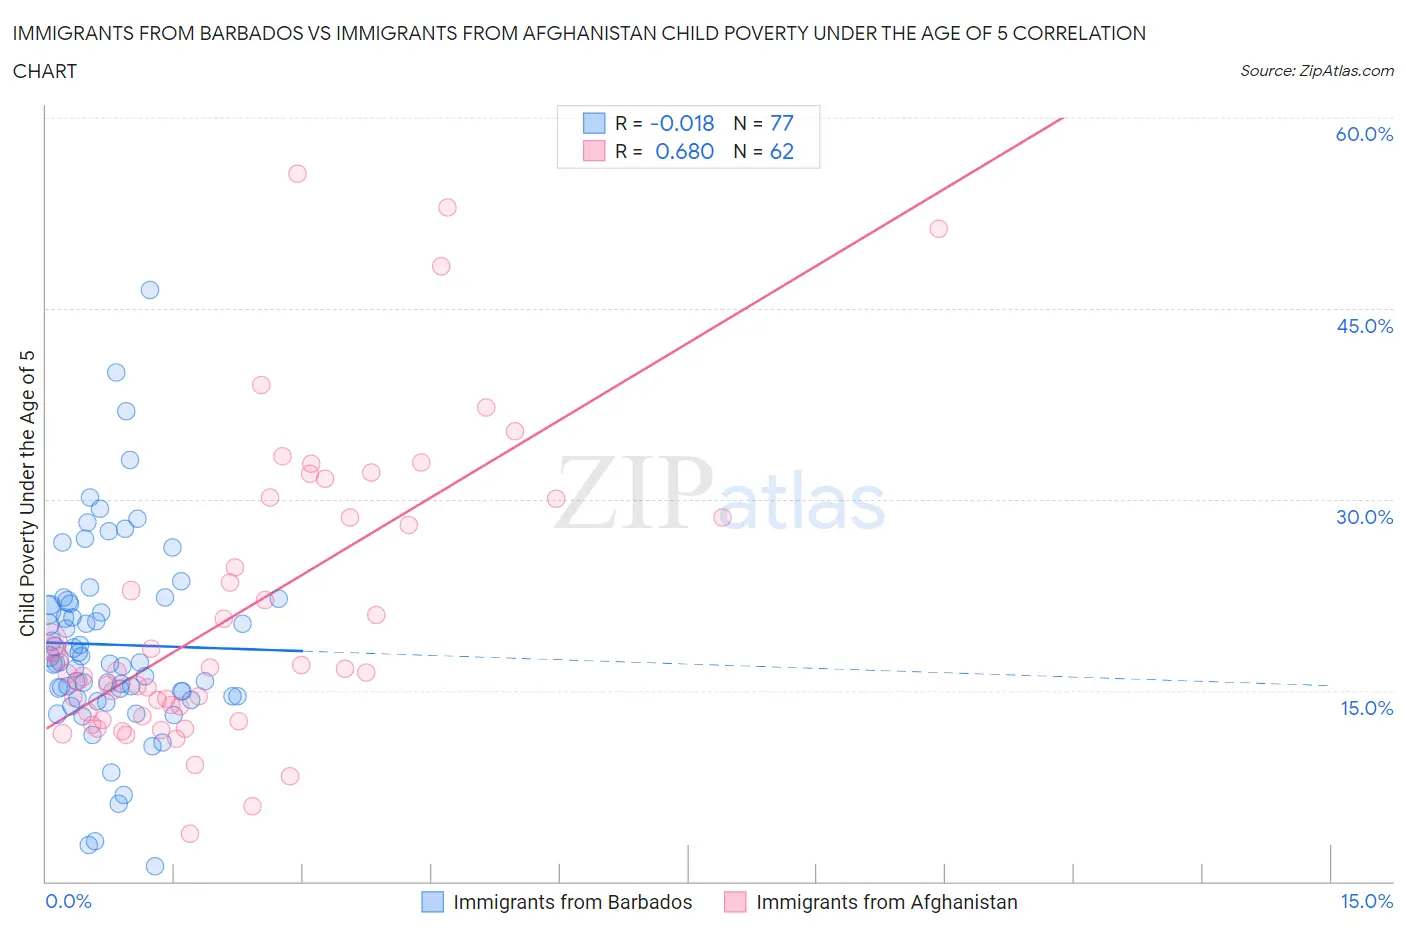
Immigrants from Barbados vs Immigrants from Afghanistan Child Poverty Under the Age of 5 Correlation Chart
The statistical analysis conducted on geographies consisting of 111,157,881 people shows no correlation between the proportion of Immigrants from Barbados and poverty level among children under the age of 5 in the United States with a correlation coefficient (R) of -0.018 and weighted average of 20.0%. Similarly, the statistical analysis conducted on geographies consisting of 145,309,010 people shows a significant positive correlation between the proportion of Immigrants from Afghanistan and poverty level among children under the age of 5 in the United States with a correlation coefficient (R) of 0.680 and weighted average of 17.7%, a difference of 13.1%.
Child Poverty Under the Age of 5 Correlation Summary
| Measurement | Immigrants from Barbados | Immigrants from Afghanistan |
| Minimum | 1.1% | 3.7% |
| Maximum | 46.4% | 55.6% |
| Range | 45.3% | 51.9% |
| Mean | 18.6% | 21.2% |
| Median | 17.1% | 16.6% |
| Interquartile 25% (IQ1) | 14.5% | 13.2% |
| Interquartile 75% (IQ3) | 21.9% | 28.6% |
| Interquartile Range (IQR) | 7.4% | 15.4% |
| Standard Deviation (Sample) | 7.7% | 11.6% |
| Standard Deviation (Population) | 7.6% | 11.5% |
Similar Demographics by Child Poverty Under the Age of 5
Demographics Similar to Immigrants from Barbados by Child Poverty Under the Age of 5
In terms of child poverty under the age of 5, the demographic groups most similar to Immigrants from Barbados are Shoshone (20.0%, a difference of 0.010%), Immigrants from St. Vincent and the Grenadines (20.0%, a difference of 0.15%), Immigrants from El Salvador (20.0%, a difference of 0.17%), Immigrants from Cuba (19.9%, a difference of 0.22%), and Fijian (19.9%, a difference of 0.32%).
| Demographics | Rating | Rank | Child Poverty Under the Age of 5 |
| Immigrants | Middle Africa | 0.4 /100 | #249 | Tragic 19.7% |
| Immigrants | Nonimmigrants | 0.4 /100 | #250 | Tragic 19.7% |
| Pennsylvania Germans | 0.3 /100 | #251 | Tragic 19.8% |
| Immigrants | Nicaragua | 0.3 /100 | #252 | Tragic 19.8% |
| Mexican American Indians | 0.3 /100 | #253 | Tragic 19.9% |
| Fijians | 0.3 /100 | #254 | Tragic 19.9% |
| Immigrants | Cuba | 0.2 /100 | #255 | Tragic 19.9% |
| Immigrants | Barbados | 0.2 /100 | #256 | Tragic 20.0% |
| Shoshone | 0.2 /100 | #257 | Tragic 20.0% |
| Immigrants | St. Vincent and the Grenadines | 0.2 /100 | #258 | Tragic 20.0% |
| Immigrants | El Salvador | 0.2 /100 | #259 | Tragic 20.0% |
| Spanish Americans | 0.2 /100 | #260 | Tragic 20.1% |
| Immigrants | Bangladesh | 0.2 /100 | #261 | Tragic 20.1% |
| Liberians | 0.1 /100 | #262 | Tragic 20.2% |
| Barbadians | 0.1 /100 | #263 | Tragic 20.2% |
Demographics Similar to Immigrants from Afghanistan by Child Poverty Under the Age of 5
In terms of child poverty under the age of 5, the demographic groups most similar to Immigrants from Afghanistan are Immigrants from Uruguay (17.7%, a difference of 0.0%), Slovak (17.6%, a difference of 0.16%), Immigrants from Uganda (17.7%, a difference of 0.37%), French Canadian (17.7%, a difference of 0.43%), and Sierra Leonean (17.7%, a difference of 0.50%).
| Demographics | Rating | Rank | Child Poverty Under the Age of 5 |
| Immigrants | Costa Rica | 39.0 /100 | #184 | Fair 17.4% |
| Immigrants | Armenia | 38.0 /100 | #185 | Fair 17.5% |
| Immigrants | Bosnia and Herzegovina | 35.0 /100 | #186 | Fair 17.5% |
| Kenyans | 34.7 /100 | #187 | Fair 17.5% |
| Carpatho Rusyns | 33.6 /100 | #188 | Fair 17.5% |
| French | 33.6 /100 | #189 | Fair 17.5% |
| Slovaks | 29.2 /100 | #190 | Fair 17.6% |
| Immigrants | Afghanistan | 27.9 /100 | #191 | Fair 17.7% |
| Immigrants | Uruguay | 27.8 /100 | #192 | Fair 17.7% |
| Immigrants | Uganda | 25.0 /100 | #193 | Fair 17.7% |
| French Canadians | 24.6 /100 | #194 | Fair 17.7% |
| Sierra Leoneans | 24.1 /100 | #195 | Fair 17.7% |
| Immigrants | Portugal | 22.2 /100 | #196 | Fair 17.8% |
| Immigrants | Kenya | 20.0 /100 | #197 | Fair 17.9% |
| Celtics | 18.3 /100 | #198 | Poor 17.9% |