Immigrants from Barbados vs Immigrants from Costa Rica Child Poverty Under the Age of 5
COMPARE
Immigrants from Barbados
Immigrants from Costa Rica
Child Poverty Under the Age of 5
Child Poverty Under the Age of 5 Comparison
Immigrants from Barbados
Immigrants from Costa Rica
20.0%
CHILD POVERTY UNDER THE AGE OF 5
0.2/ 100
METRIC RATING
256th/ 347
METRIC RANK
17.4%
CHILD POVERTY UNDER THE AGE OF 5
39.0/ 100
METRIC RATING
184th/ 347
METRIC RANK
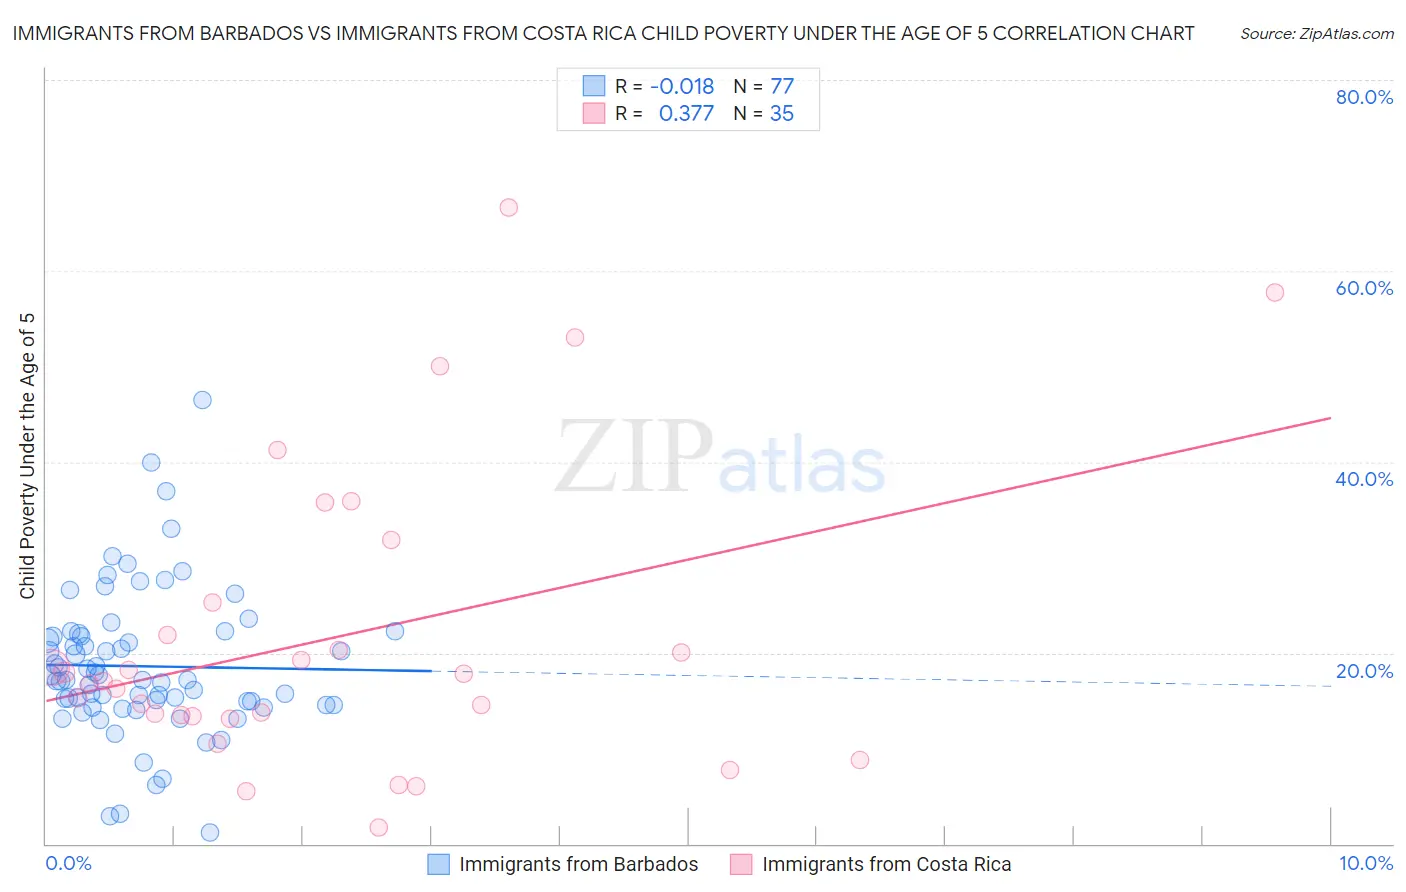
Immigrants from Barbados vs Immigrants from Costa Rica Child Poverty Under the Age of 5 Correlation Chart
The statistical analysis conducted on geographies consisting of 111,157,881 people shows no correlation between the proportion of Immigrants from Barbados and poverty level among children under the age of 5 in the United States with a correlation coefficient (R) of -0.018 and weighted average of 20.0%. Similarly, the statistical analysis conducted on geographies consisting of 200,253,710 people shows a mild positive correlation between the proportion of Immigrants from Costa Rica and poverty level among children under the age of 5 in the United States with a correlation coefficient (R) of 0.377 and weighted average of 17.4%, a difference of 14.5%.
Child Poverty Under the Age of 5 Correlation Summary
| Measurement | Immigrants from Barbados | Immigrants from Costa Rica |
| Minimum | 1.1% | 1.7% |
| Maximum | 46.4% | 66.7% |
| Range | 45.3% | 65.0% |
| Mean | 18.6% | 21.7% |
| Median | 17.1% | 17.1% |
| Interquartile 25% (IQ1) | 14.5% | 13.3% |
| Interquartile 75% (IQ3) | 21.9% | 25.2% |
| Interquartile Range (IQR) | 7.4% | 11.9% |
| Standard Deviation (Sample) | 7.7% | 15.6% |
| Standard Deviation (Population) | 7.6% | 15.4% |
Similar Demographics by Child Poverty Under the Age of 5
Demographics Similar to Immigrants from Barbados by Child Poverty Under the Age of 5
In terms of child poverty under the age of 5, the demographic groups most similar to Immigrants from Barbados are Shoshone (20.0%, a difference of 0.010%), Immigrants from St. Vincent and the Grenadines (20.0%, a difference of 0.15%), Immigrants from El Salvador (20.0%, a difference of 0.17%), Immigrants from Cuba (19.9%, a difference of 0.22%), and Fijian (19.9%, a difference of 0.32%).
| Demographics | Rating | Rank | Child Poverty Under the Age of 5 |
| Immigrants | Middle Africa | 0.4 /100 | #249 | Tragic 19.7% |
| Immigrants | Nonimmigrants | 0.4 /100 | #250 | Tragic 19.7% |
| Pennsylvania Germans | 0.3 /100 | #251 | Tragic 19.8% |
| Immigrants | Nicaragua | 0.3 /100 | #252 | Tragic 19.8% |
| Mexican American Indians | 0.3 /100 | #253 | Tragic 19.9% |
| Fijians | 0.3 /100 | #254 | Tragic 19.9% |
| Immigrants | Cuba | 0.2 /100 | #255 | Tragic 19.9% |
| Immigrants | Barbados | 0.2 /100 | #256 | Tragic 20.0% |
| Shoshone | 0.2 /100 | #257 | Tragic 20.0% |
| Immigrants | St. Vincent and the Grenadines | 0.2 /100 | #258 | Tragic 20.0% |
| Immigrants | El Salvador | 0.2 /100 | #259 | Tragic 20.0% |
| Spanish Americans | 0.2 /100 | #260 | Tragic 20.1% |
| Immigrants | Bangladesh | 0.2 /100 | #261 | Tragic 20.1% |
| Liberians | 0.1 /100 | #262 | Tragic 20.2% |
| Barbadians | 0.1 /100 | #263 | Tragic 20.2% |
Demographics Similar to Immigrants from Costa Rica by Child Poverty Under the Age of 5
In terms of child poverty under the age of 5, the demographic groups most similar to Immigrants from Costa Rica are Immigrants from Armenia (17.5%, a difference of 0.11%), Lebanese (17.4%, a difference of 0.14%), Arab (17.4%, a difference of 0.18%), Immigrants from Germany (17.4%, a difference of 0.21%), and South American Indian (17.4%, a difference of 0.25%).
| Demographics | Rating | Rank | Child Poverty Under the Age of 5 |
| Immigrants | Sierra Leone | 43.6 /100 | #177 | Average 17.3% |
| Immigrants | Cameroon | 42.7 /100 | #178 | Average 17.4% |
| Hawaiians | 41.5 /100 | #179 | Average 17.4% |
| South American Indians | 41.4 /100 | #180 | Average 17.4% |
| Immigrants | Germany | 41.0 /100 | #181 | Average 17.4% |
| Arabs | 40.7 /100 | #182 | Average 17.4% |
| Lebanese | 40.3 /100 | #183 | Average 17.4% |
| Immigrants | Costa Rica | 39.0 /100 | #184 | Fair 17.4% |
| Immigrants | Armenia | 38.0 /100 | #185 | Fair 17.5% |
| Immigrants | Bosnia and Herzegovina | 35.0 /100 | #186 | Fair 17.5% |
| Kenyans | 34.7 /100 | #187 | Fair 17.5% |
| Carpatho Rusyns | 33.6 /100 | #188 | Fair 17.5% |
| French | 33.6 /100 | #189 | Fair 17.5% |
| Slovaks | 29.2 /100 | #190 | Fair 17.6% |
| Immigrants | Afghanistan | 27.9 /100 | #191 | Fair 17.7% |