Immigrants from North Macedonia vs Immigrants from Ecuador Child Poverty Under the Age of 5
COMPARE
Immigrants from North Macedonia
Immigrants from Ecuador
Child Poverty Under the Age of 5
Child Poverty Under the Age of 5 Comparison
Immigrants from North Macedonia
Immigrants from Ecuador
16.4%
CHILD POVERTY UNDER THE AGE OF 5
87.8/ 100
METRIC RATING
134th/ 347
METRIC RANK
19.6%
CHILD POVERTY UNDER THE AGE OF 5
0.5/ 100
METRIC RATING
240th/ 347
METRIC RANK
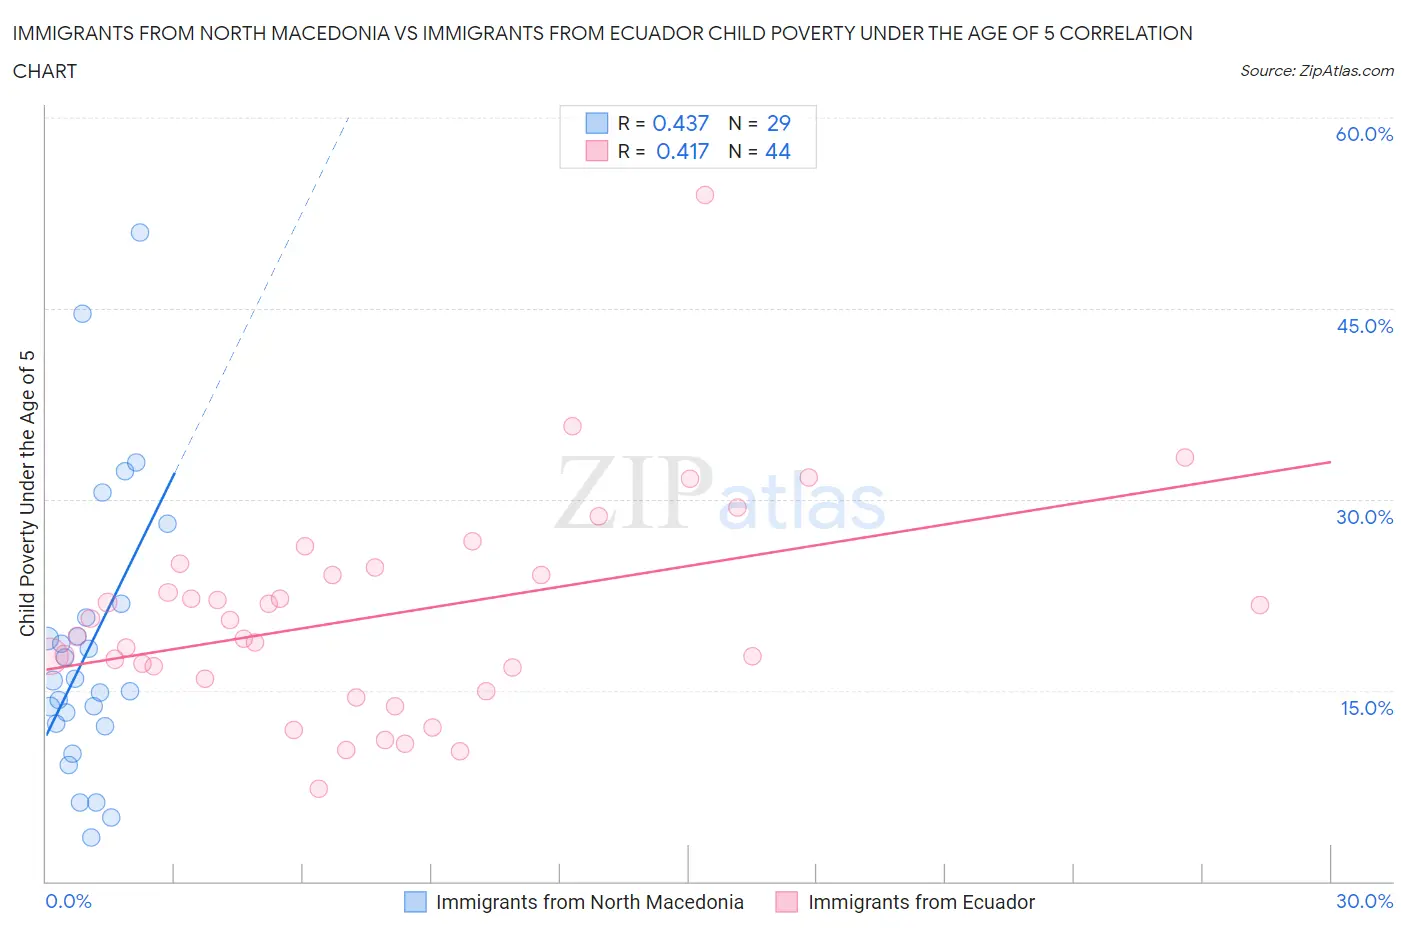
Immigrants from North Macedonia vs Immigrants from Ecuador Child Poverty Under the Age of 5 Correlation Chart
The statistical analysis conducted on geographies consisting of 72,663,175 people shows a moderate positive correlation between the proportion of Immigrants from North Macedonia and poverty level among children under the age of 5 in the United States with a correlation coefficient (R) of 0.437 and weighted average of 16.4%. Similarly, the statistical analysis conducted on geographies consisting of 262,656,559 people shows a moderate positive correlation between the proportion of Immigrants from Ecuador and poverty level among children under the age of 5 in the United States with a correlation coefficient (R) of 0.417 and weighted average of 19.6%, a difference of 19.8%.
Child Poverty Under the Age of 5 Correlation Summary
| Measurement | Immigrants from North Macedonia | Immigrants from Ecuador |
| Minimum | 3.4% | 7.3% |
| Maximum | 51.0% | 53.9% |
| Range | 47.6% | 46.6% |
| Mean | 18.5% | 20.9% |
| Median | 15.8% | 19.9% |
| Interquartile 25% (IQ1) | 12.3% | 16.4% |
| Interquartile 75% (IQ3) | 21.3% | 24.4% |
| Interquartile Range (IQR) | 9.0% | 8.0% |
| Standard Deviation (Sample) | 11.1% | 8.3% |
| Standard Deviation (Population) | 10.9% | 8.2% |
Similar Demographics by Child Poverty Under the Age of 5
Demographics Similar to Immigrants from North Macedonia by Child Poverty Under the Age of 5
In terms of child poverty under the age of 5, the demographic groups most similar to Immigrants from North Macedonia are Brazilian (16.4%, a difference of 0.010%), Icelander (16.3%, a difference of 0.020%), Immigrants from Northern Africa (16.4%, a difference of 0.070%), Serbian (16.3%, a difference of 0.090%), and Finnish (16.3%, a difference of 0.12%).
| Demographics | Rating | Rank | Child Poverty Under the Age of 5 |
| Immigrants | England | 91.5 /100 | #127 | Exceptional 16.2% |
| South Africans | 90.1 /100 | #128 | Exceptional 16.2% |
| British | 89.4 /100 | #129 | Excellent 16.3% |
| Immigrants | Norway | 89.3 /100 | #130 | Excellent 16.3% |
| Finns | 88.3 /100 | #131 | Excellent 16.3% |
| Serbians | 88.2 /100 | #132 | Excellent 16.3% |
| Icelanders | 87.9 /100 | #133 | Excellent 16.3% |
| Immigrants | North Macedonia | 87.8 /100 | #134 | Excellent 16.4% |
| Brazilians | 87.8 /100 | #135 | Excellent 16.4% |
| Immigrants | Northern Africa | 87.5 /100 | #136 | Excellent 16.4% |
| Immigrants | Chile | 85.3 /100 | #137 | Excellent 16.4% |
| Germans | 84.8 /100 | #138 | Excellent 16.5% |
| Immigrants | Hungary | 84.5 /100 | #139 | Excellent 16.5% |
| Guamanians/Chamorros | 84.2 /100 | #140 | Excellent 16.5% |
| Immigrants | Western Europe | 83.3 /100 | #141 | Excellent 16.5% |
Demographics Similar to Immigrants from Ecuador by Child Poverty Under the Age of 5
In terms of child poverty under the age of 5, the demographic groups most similar to Immigrants from Ecuador are Alaska Native (19.6%, a difference of 0.060%), Immigrants from Guyana (19.6%, a difference of 0.18%), Osage (19.6%, a difference of 0.28%), Immigrants from Ghana (19.6%, a difference of 0.30%), and Vietnamese (19.5%, a difference of 0.37%).
| Demographics | Rating | Rank | Child Poverty Under the Age of 5 |
| Sudanese | 0.9 /100 | #233 | Tragic 19.3% |
| Immigrants | Micronesia | 0.9 /100 | #234 | Tragic 19.4% |
| Immigrants | Laos | 0.8 /100 | #235 | Tragic 19.4% |
| Immigrants | Trinidad and Tobago | 0.8 /100 | #236 | Tragic 19.4% |
| Immigrants | Cabo Verde | 0.6 /100 | #237 | Tragic 19.5% |
| Salvadorans | 0.6 /100 | #238 | Tragic 19.5% |
| Vietnamese | 0.6 /100 | #239 | Tragic 19.5% |
| Immigrants | Ecuador | 0.5 /100 | #240 | Tragic 19.6% |
| Alaska Natives | 0.5 /100 | #241 | Tragic 19.6% |
| Immigrants | Guyana | 0.5 /100 | #242 | Tragic 19.6% |
| Osage | 0.5 /100 | #243 | Tragic 19.6% |
| Immigrants | Ghana | 0.5 /100 | #244 | Tragic 19.6% |
| Immigrants | Western Africa | 0.4 /100 | #245 | Tragic 19.7% |
| Cree | 0.4 /100 | #246 | Tragic 19.7% |
| Guyanese | 0.4 /100 | #247 | Tragic 19.7% |