French Canadian vs Menominee Female Poverty Among 25-34 Year Olds
COMPARE
French Canadian
Menominee
Female Poverty Among 25-34 Year Olds
Female Poverty Among 25-34 Year Olds Comparison
French Canadians
Menominee
14.3%
FEMALE POVERTY AMONG 25-34 YEAR OLDS
5.5/ 100
METRIC RATING
216th/ 347
METRIC RANK
18.0%
FEMALE POVERTY AMONG 25-34 YEAR OLDS
0.0/ 100
METRIC RATING
319th/ 347
METRIC RANK
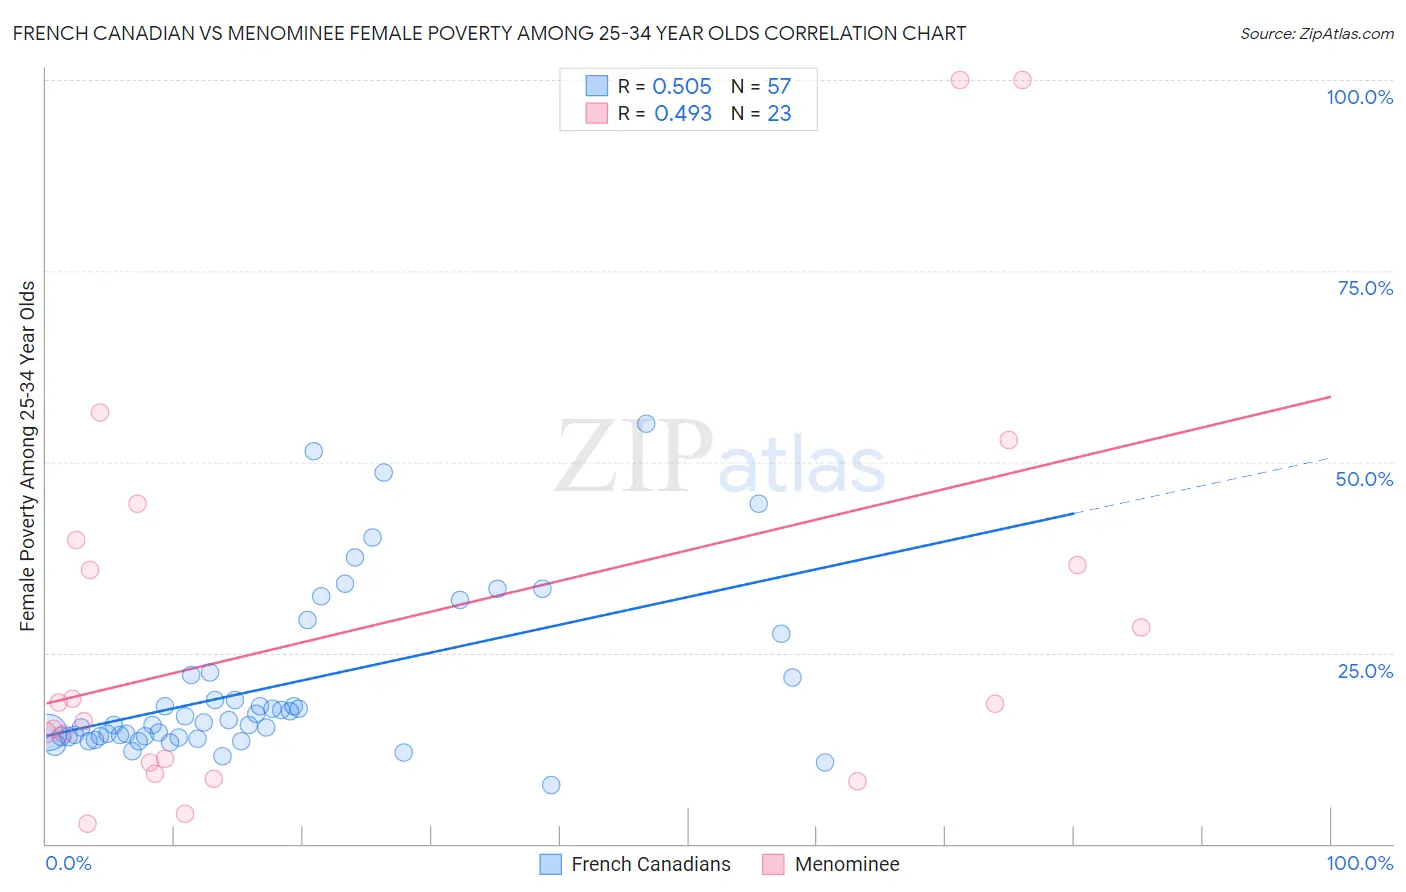
French Canadian vs Menominee Female Poverty Among 25-34 Year Olds Correlation Chart
The statistical analysis conducted on geographies consisting of 488,016,445 people shows a substantial positive correlation between the proportion of French Canadians and poverty level among females between the ages 25 and 34 in the United States with a correlation coefficient (R) of 0.505 and weighted average of 14.3%. Similarly, the statistical analysis conducted on geographies consisting of 45,599,400 people shows a moderate positive correlation between the proportion of Menominee and poverty level among females between the ages 25 and 34 in the United States with a correlation coefficient (R) of 0.493 and weighted average of 18.0%, a difference of 25.4%.
Female Poverty Among 25-34 Year Olds Correlation Summary
| Measurement | French Canadian | Menominee |
| Minimum | 7.7% | 2.7% |
| Maximum | 55.0% | 100.0% |
| Range | 47.3% | 97.3% |
| Mean | 20.6% | 28.9% |
| Median | 15.8% | 18.4% |
| Interquartile 25% (IQ1) | 14.0% | 10.6% |
| Interquartile 75% (IQ3) | 22.2% | 39.8% |
| Interquartile Range (IQR) | 8.2% | 29.2% |
| Standard Deviation (Sample) | 10.9% | 27.1% |
| Standard Deviation (Population) | 10.8% | 26.5% |
Similar Demographics by Female Poverty Among 25-34 Year Olds
Demographics Similar to French Canadians by Female Poverty Among 25-34 Year Olds
In terms of female poverty among 25-34 year olds, the demographic groups most similar to French Canadians are Spanish American Indian (14.3%, a difference of 0.0%), Immigrants from Thailand (14.3%, a difference of 0.11%), Ecuadorian (14.3%, a difference of 0.12%), Immigrants from Nigeria (14.3%, a difference of 0.25%), and French (14.3%, a difference of 0.27%).
| Demographics | Rating | Rank | Female Poverty Among 25-34 Year Olds |
| Guyanese | 8.6 /100 | #209 | Tragic 14.2% |
| Panamanians | 8.6 /100 | #210 | Tragic 14.2% |
| Trinidadians and Tobagonians | 8.2 /100 | #211 | Tragic 14.2% |
| Immigrants | Guyana | 6.6 /100 | #212 | Tragic 14.3% |
| Puget Sound Salish | 6.5 /100 | #213 | Tragic 14.3% |
| French | 6.2 /100 | #214 | Tragic 14.3% |
| Immigrants | Nigeria | 6.2 /100 | #215 | Tragic 14.3% |
| French Canadians | 5.5 /100 | #216 | Tragic 14.3% |
| Spanish American Indians | 5.5 /100 | #217 | Tragic 14.3% |
| Immigrants | Thailand | 5.2 /100 | #218 | Tragic 14.3% |
| Ecuadorians | 5.2 /100 | #219 | Tragic 14.3% |
| Ghanaians | 4.8 /100 | #220 | Tragic 14.4% |
| Sudanese | 4.4 /100 | #221 | Tragic 14.4% |
| Immigrants | Portugal | 4.3 /100 | #222 | Tragic 14.4% |
| Nigerians | 4.2 /100 | #223 | Tragic 14.4% |
Demographics Similar to Menominee by Female Poverty Among 25-34 Year Olds
In terms of female poverty among 25-34 year olds, the demographic groups most similar to Menominee are Chippewa (18.0%, a difference of 0.26%), Choctaw (18.1%, a difference of 0.47%), Ute (17.9%, a difference of 0.55%), Arapaho (17.8%, a difference of 1.1%), and Central American Indian (18.2%, a difference of 1.3%).
| Demographics | Rating | Rank | Female Poverty Among 25-34 Year Olds |
| Iroquois | 0.0 /100 | #312 | Tragic 17.5% |
| Colville | 0.0 /100 | #313 | Tragic 17.5% |
| Immigrants | Dominican Republic | 0.0 /100 | #314 | Tragic 17.6% |
| Yakama | 0.0 /100 | #315 | Tragic 17.6% |
| Dominicans | 0.0 /100 | #316 | Tragic 17.6% |
| Arapaho | 0.0 /100 | #317 | Tragic 17.8% |
| Ute | 0.0 /100 | #318 | Tragic 17.9% |
| Menominee | 0.0 /100 | #319 | Tragic 18.0% |
| Chippewa | 0.0 /100 | #320 | Tragic 18.0% |
| Choctaw | 0.0 /100 | #321 | Tragic 18.1% |
| Central American Indians | 0.0 /100 | #322 | Tragic 18.2% |
| Seminole | 0.0 /100 | #323 | Tragic 18.3% |
| Dutch West Indians | 0.0 /100 | #324 | Tragic 18.4% |
| Inupiat | 0.0 /100 | #325 | Tragic 18.5% |
| Blacks/African Americans | 0.0 /100 | #326 | Tragic 18.9% |