Immigrants from Bangladesh vs Immigrants from South Africa Female Poverty Among 25-34 Year Olds
COMPARE
Immigrants from Bangladesh
Immigrants from South Africa
Female Poverty Among 25-34 Year Olds
Female Poverty Among 25-34 Year Olds Comparison
Immigrants from Bangladesh
Immigrants from South Africa
14.8%
FEMALE POVERTY AMONG 25-34 YEAR OLDS
1.1/ 100
METRIC RATING
244th/ 347
METRIC RANK
12.7%
FEMALE POVERTY AMONG 25-34 YEAR OLDS
95.3/ 100
METRIC RATING
105th/ 347
METRIC RANK
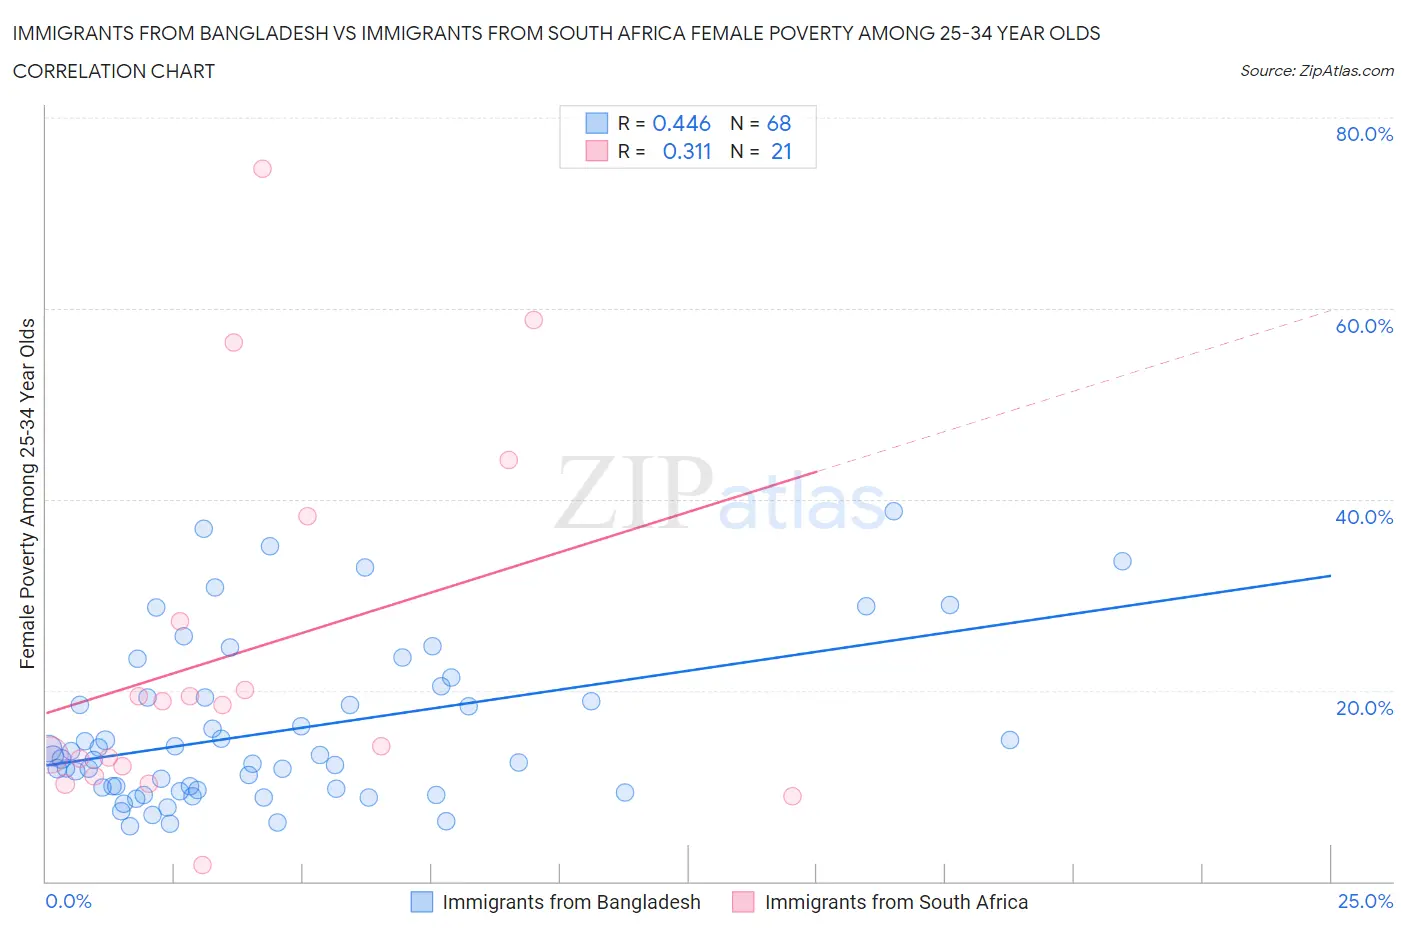
Immigrants from Bangladesh vs Immigrants from South Africa Female Poverty Among 25-34 Year Olds Correlation Chart
The statistical analysis conducted on geographies consisting of 202,108,312 people shows a moderate positive correlation between the proportion of Immigrants from Bangladesh and poverty level among females between the ages 25 and 34 in the United States with a correlation coefficient (R) of 0.446 and weighted average of 14.8%. Similarly, the statistical analysis conducted on geographies consisting of 230,050,915 people shows a mild positive correlation between the proportion of Immigrants from South Africa and poverty level among females between the ages 25 and 34 in the United States with a correlation coefficient (R) of 0.311 and weighted average of 12.7%, a difference of 16.6%.
Female Poverty Among 25-34 Year Olds Correlation Summary
| Measurement | Immigrants from Bangladesh | Immigrants from South Africa |
| Minimum | 5.7% | 1.8% |
| Maximum | 38.8% | 74.6% |
| Range | 33.0% | 72.8% |
| Mean | 15.8% | 23.9% |
| Median | 12.9% | 18.5% |
| Interquartile 25% (IQ1) | 9.6% | 11.6% |
| Interquartile 75% (IQ3) | 19.2% | 32.7% |
| Interquartile Range (IQR) | 9.6% | 21.1% |
| Standard Deviation (Sample) | 8.3% | 19.3% |
| Standard Deviation (Population) | 8.2% | 18.8% |
Similar Demographics by Female Poverty Among 25-34 Year Olds
Demographics Similar to Immigrants from Bangladesh by Female Poverty Among 25-34 Year Olds
In terms of female poverty among 25-34 year olds, the demographic groups most similar to Immigrants from Bangladesh are Immigrants from Nicaragua (14.8%, a difference of 0.010%), Scotch-Irish (14.8%, a difference of 0.040%), Barbadian (14.8%, a difference of 0.040%), Immigrants from Middle Africa (14.8%, a difference of 0.18%), and Jamaican (14.8%, a difference of 0.22%).
| Demographics | Rating | Rank | Female Poverty Among 25-34 Year Olds |
| Immigrants | Ghana | 1.4 /100 | #237 | Tragic 14.7% |
| Alsatians | 1.4 /100 | #238 | Tragic 14.7% |
| Malaysians | 1.4 /100 | #239 | Tragic 14.7% |
| Immigrants | Grenada | 1.3 /100 | #240 | Tragic 14.7% |
| Scotch-Irish | 1.2 /100 | #241 | Tragic 14.8% |
| Barbadians | 1.2 /100 | #242 | Tragic 14.8% |
| Immigrants | Nicaragua | 1.1 /100 | #243 | Tragic 14.8% |
| Immigrants | Bangladesh | 1.1 /100 | #244 | Tragic 14.8% |
| Immigrants | Middle Africa | 1.0 /100 | #245 | Tragic 14.8% |
| Jamaicans | 1.0 /100 | #246 | Tragic 14.8% |
| German Russians | 0.8 /100 | #247 | Tragic 14.9% |
| Immigrants | Western Africa | 0.8 /100 | #248 | Tragic 14.9% |
| Immigrants | Haiti | 0.5 /100 | #249 | Tragic 15.0% |
| Immigrants | El Salvador | 0.5 /100 | #250 | Tragic 15.0% |
| Haitians | 0.5 /100 | #251 | Tragic 15.0% |
Demographics Similar to Immigrants from South Africa by Female Poverty Among 25-34 Year Olds
In terms of female poverty among 25-34 year olds, the demographic groups most similar to Immigrants from South Africa are Swedish (12.7%, a difference of 0.050%), Immigrants from Spain (12.7%, a difference of 0.090%), Tsimshian (12.7%, a difference of 0.10%), Polish (12.7%, a difference of 0.15%), and Peruvian (12.7%, a difference of 0.16%).
| Demographics | Rating | Rank | Female Poverty Among 25-34 Year Olds |
| Immigrants | Ethiopia | 96.5 /100 | #98 | Exceptional 12.6% |
| Immigrants | Argentina | 96.4 /100 | #99 | Exceptional 12.6% |
| Immigrants | Denmark | 95.7 /100 | #100 | Exceptional 12.7% |
| Immigrants | Switzerland | 95.7 /100 | #101 | Exceptional 12.7% |
| Peruvians | 95.6 /100 | #102 | Exceptional 12.7% |
| Immigrants | Spain | 95.5 /100 | #103 | Exceptional 12.7% |
| Swedes | 95.4 /100 | #104 | Exceptional 12.7% |
| Immigrants | South Africa | 95.3 /100 | #105 | Exceptional 12.7% |
| Tsimshian | 95.1 /100 | #106 | Exceptional 12.7% |
| Poles | 94.9 /100 | #107 | Exceptional 12.7% |
| Immigrants | Norway | 94.4 /100 | #108 | Exceptional 12.7% |
| Immigrants | Peru | 94.3 /100 | #109 | Exceptional 12.7% |
| Australians | 94.1 /100 | #110 | Exceptional 12.8% |
| Danes | 93.9 /100 | #111 | Exceptional 12.8% |
| Immigrants | Morocco | 93.9 /100 | #112 | Exceptional 12.8% |