Immigrants from Bangladesh vs Lumbee 4th Grade
COMPARE
Immigrants from Bangladesh
Lumbee
4th Grade
4th Grade Comparison
Immigrants from Bangladesh
Lumbee
96.2%
4TH GRADE
0.0/ 100
METRIC RATING
311th/ 347
METRIC RANK
98.0%
4TH GRADE
99.6/ 100
METRIC RATING
71st/ 347
METRIC RANK
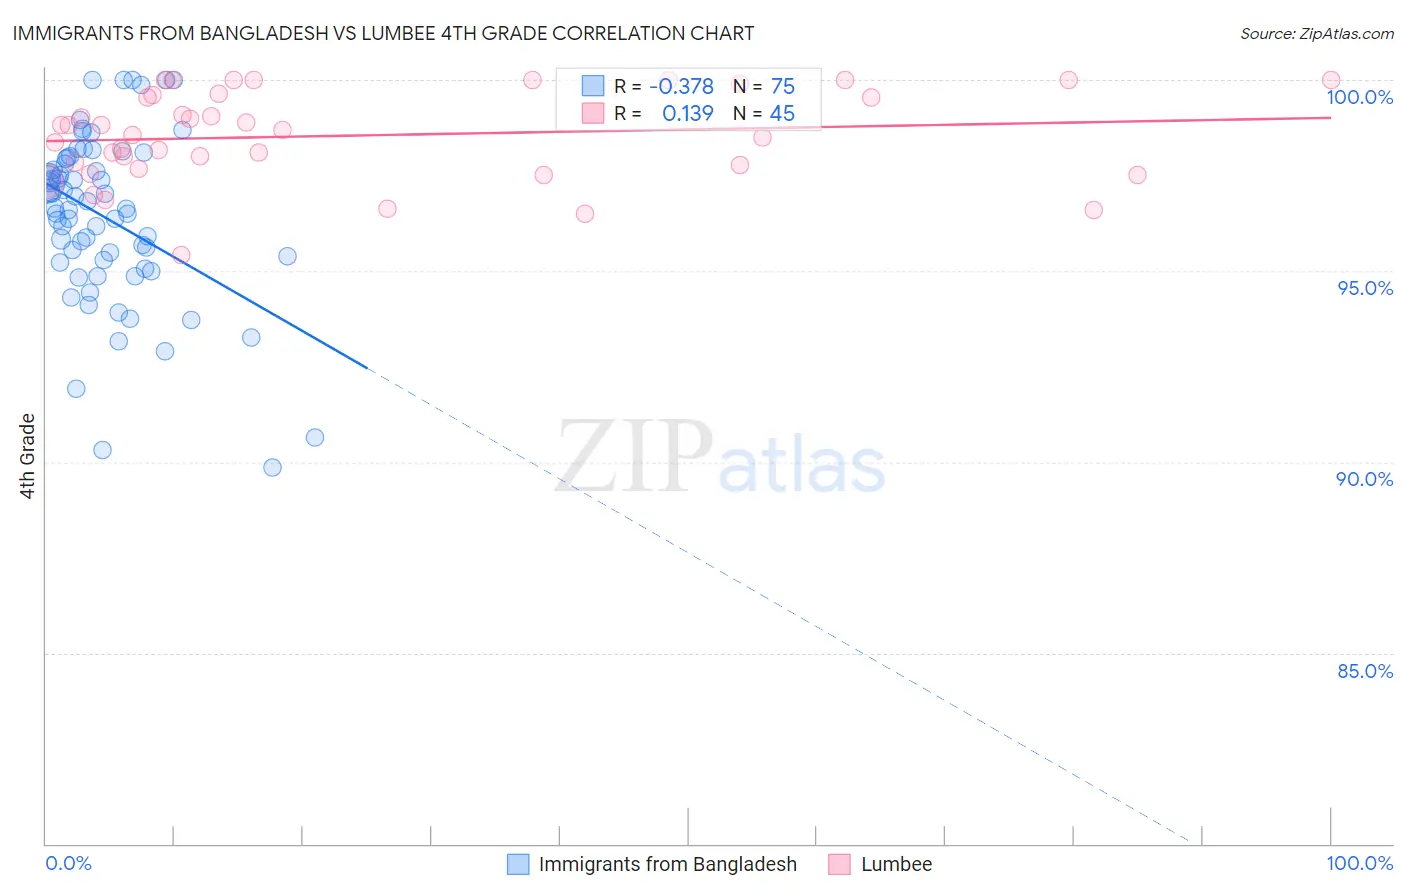
Immigrants from Bangladesh vs Lumbee 4th Grade Correlation Chart
The statistical analysis conducted on geographies consisting of 203,671,281 people shows a mild negative correlation between the proportion of Immigrants from Bangladesh and percentage of population with at least 4th grade education in the United States with a correlation coefficient (R) of -0.378 and weighted average of 96.2%. Similarly, the statistical analysis conducted on geographies consisting of 92,298,549 people shows a poor positive correlation between the proportion of Lumbee and percentage of population with at least 4th grade education in the United States with a correlation coefficient (R) of 0.139 and weighted average of 98.0%, a difference of 1.8%.
4th Grade Correlation Summary
| Measurement | Immigrants from Bangladesh | Lumbee |
| Minimum | 89.8% | 95.4% |
| Maximum | 100.0% | 100.0% |
| Range | 10.2% | 4.6% |
| Mean | 96.4% | 98.5% |
| Median | 96.6% | 98.7% |
| Interquartile 25% (IQ1) | 95.2% | 97.7% |
| Interquartile 75% (IQ3) | 97.9% | 99.6% |
| Interquartile Range (IQR) | 2.7% | 1.9% |
| Standard Deviation (Sample) | 2.2% | 1.2% |
| Standard Deviation (Population) | 2.2% | 1.2% |
Similar Demographics by 4th Grade
Demographics Similar to Immigrants from Bangladesh by 4th Grade
In terms of 4th grade, the demographic groups most similar to Immigrants from Bangladesh are Cape Verdean (96.2%, a difference of 0.010%), Indonesian (96.2%, a difference of 0.020%), Vietnamese (96.2%, a difference of 0.030%), Nicaraguan (96.2%, a difference of 0.030%), and Immigrants from Ecuador (96.2%, a difference of 0.040%).
| Demographics | Rating | Rank | 4th Grade |
| Ecuadorians | 0.0 /100 | #304 | Tragic 96.4% |
| Immigrants | Caribbean | 0.0 /100 | #305 | Tragic 96.4% |
| Sri Lankans | 0.0 /100 | #306 | Tragic 96.4% |
| Immigrants | Haiti | 0.0 /100 | #307 | Tragic 96.3% |
| Immigrants | Laos | 0.0 /100 | #308 | Tragic 96.3% |
| Immigrants | Guyana | 0.0 /100 | #309 | Tragic 96.3% |
| Immigrants | Burma/Myanmar | 0.0 /100 | #310 | Tragic 96.3% |
| Immigrants | Bangladesh | 0.0 /100 | #311 | Tragic 96.2% |
| Cape Verdeans | 0.0 /100 | #312 | Tragic 96.2% |
| Indonesians | 0.0 /100 | #313 | Tragic 96.2% |
| Vietnamese | 0.0 /100 | #314 | Tragic 96.2% |
| Nicaraguans | 0.0 /100 | #315 | Tragic 96.2% |
| Immigrants | Ecuador | 0.0 /100 | #316 | Tragic 96.2% |
| Central American Indians | 0.0 /100 | #317 | Tragic 96.2% |
| Immigrants | Azores | 0.0 /100 | #318 | Tragic 96.1% |
Demographics Similar to Lumbee by 4th Grade
In terms of 4th grade, the demographic groups most similar to Lumbee are Kiowa (98.0%, a difference of 0.0%), Pueblo (98.0%, a difference of 0.0%), Immigrants from Austria (98.0%, a difference of 0.0%), Immigrants from Northern Europe (98.0%, a difference of 0.010%), and Canadian (98.0%, a difference of 0.010%).
| Demographics | Rating | Rank | 4th Grade |
| Cajuns | 99.7 /100 | #64 | Exceptional 98.0% |
| Immigrants | Northern Europe | 99.6 /100 | #65 | Exceptional 98.0% |
| Canadians | 99.6 /100 | #66 | Exceptional 98.0% |
| New Zealanders | 99.6 /100 | #67 | Exceptional 98.0% |
| Kiowa | 99.6 /100 | #68 | Exceptional 98.0% |
| Pueblo | 99.6 /100 | #69 | Exceptional 98.0% |
| Immigrants | Austria | 99.6 /100 | #70 | Exceptional 98.0% |
| Lumbee | 99.6 /100 | #71 | Exceptional 98.0% |
| Iranians | 99.4 /100 | #72 | Exceptional 98.0% |
| Macedonians | 99.4 /100 | #73 | Exceptional 98.0% |
| Chickasaw | 99.4 /100 | #74 | Exceptional 98.0% |
| Immigrants | Netherlands | 99.3 /100 | #75 | Exceptional 98.0% |
| Cherokee | 99.3 /100 | #76 | Exceptional 98.0% |
| Immigrants | Lithuania | 99.3 /100 | #77 | Exceptional 98.0% |
| Immigrants | England | 99.3 /100 | #78 | Exceptional 98.0% |