Immigrants from Bahamas vs Immigrants from Dominican Republic Bachelor's Degree
COMPARE
Immigrants from Bahamas
Immigrants from Dominican Republic
Bachelor's Degree
Bachelor's Degree Comparison
Immigrants from Bahamas
Immigrants from Dominican Republic
33.3%
BACHELOR'S DEGREE
0.7/ 100
METRIC RATING
252nd/ 347
METRIC RANK
30.7%
BACHELOR'S DEGREE
0.0/ 100
METRIC RATING
295th/ 347
METRIC RANK
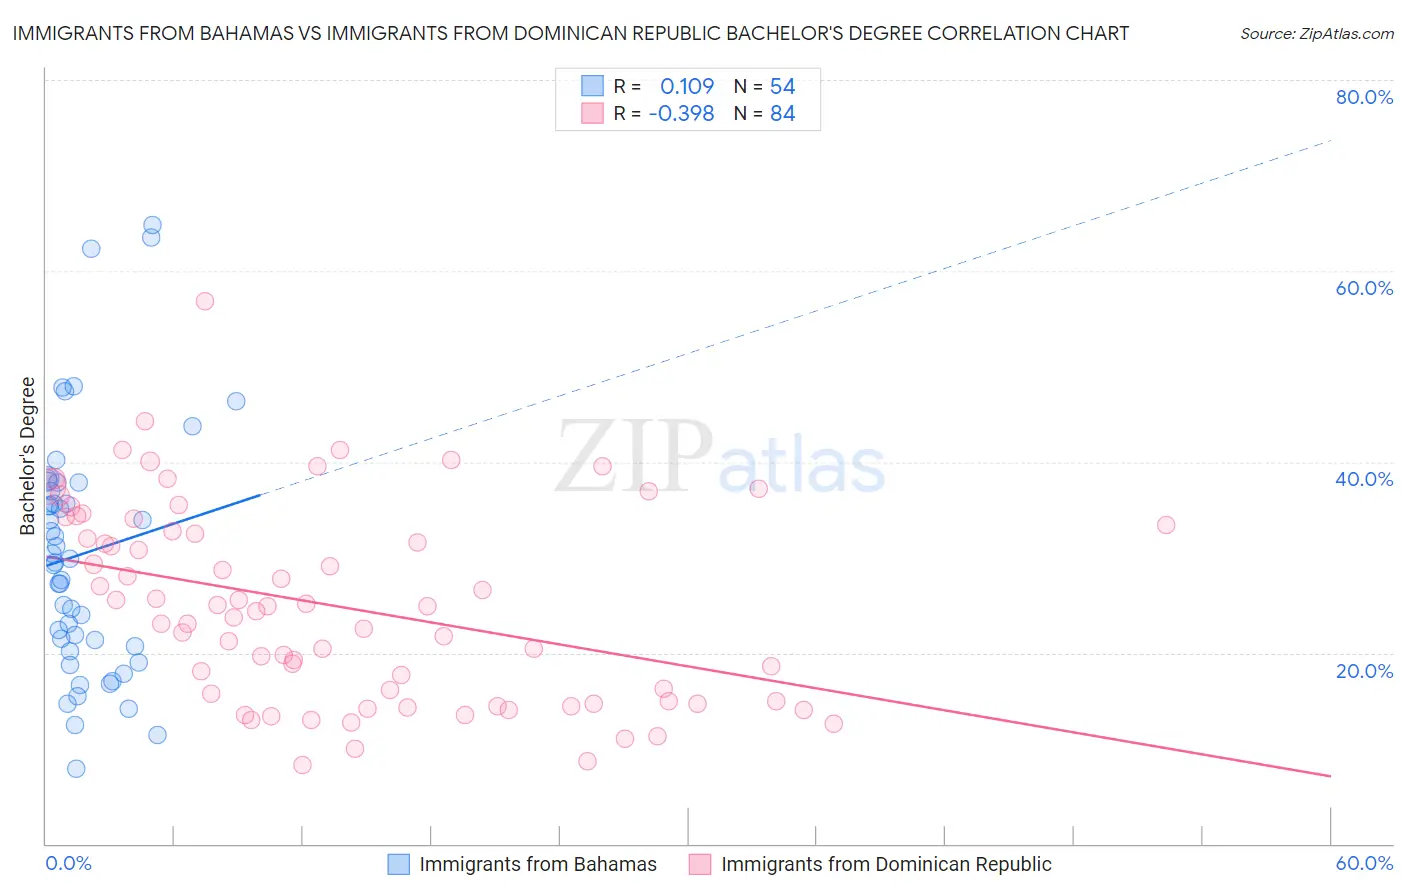
Immigrants from Bahamas vs Immigrants from Dominican Republic Bachelor's Degree Correlation Chart
The statistical analysis conducted on geographies consisting of 104,662,355 people shows a poor positive correlation between the proportion of Immigrants from Bahamas and percentage of population with at least bachelor's degree education in the United States with a correlation coefficient (R) of 0.109 and weighted average of 33.3%. Similarly, the statistical analysis conducted on geographies consisting of 275,132,010 people shows a mild negative correlation between the proportion of Immigrants from Dominican Republic and percentage of population with at least bachelor's degree education in the United States with a correlation coefficient (R) of -0.398 and weighted average of 30.7%, a difference of 8.5%.
Bachelor's Degree Correlation Summary
| Measurement | Immigrants from Bahamas | Immigrants from Dominican Republic |
| Minimum | 7.9% | 8.2% |
| Maximum | 64.8% | 56.8% |
| Range | 56.9% | 48.6% |
| Mean | 30.4% | 24.9% |
| Median | 29.6% | 24.6% |
| Interquartile 25% (IQ1) | 20.7% | 14.9% |
| Interquartile 75% (IQ3) | 37.8% | 33.0% |
| Interquartile Range (IQR) | 17.1% | 18.1% |
| Standard Deviation (Sample) | 12.9% | 10.2% |
| Standard Deviation (Population) | 12.8% | 10.1% |
Similar Demographics by Bachelor's Degree
Demographics Similar to Immigrants from Bahamas by Bachelor's Degree
In terms of bachelor's degree, the demographic groups most similar to Immigrants from Bahamas are Japanese (33.3%, a difference of 0.070%), U.S. Virgin Islander (33.2%, a difference of 0.21%), Native Hawaiian (33.2%, a difference of 0.27%), Iroquois (33.2%, a difference of 0.28%), and Nicaraguan (33.1%, a difference of 0.47%).
| Demographics | Rating | Rank | Bachelor's Degree |
| Immigrants | Fiji | 1.2 /100 | #245 | Tragic 33.7% |
| Jamaicans | 1.0 /100 | #246 | Tragic 33.6% |
| Immigrants | Congo | 1.0 /100 | #247 | Tragic 33.6% |
| Cree | 1.0 /100 | #248 | Tragic 33.6% |
| Immigrants | Liberia | 0.9 /100 | #249 | Tragic 33.5% |
| Indonesians | 0.9 /100 | #250 | Tragic 33.5% |
| Japanese | 0.7 /100 | #251 | Tragic 33.3% |
| Immigrants | Bahamas | 0.7 /100 | #252 | Tragic 33.3% |
| U.S. Virgin Islanders | 0.7 /100 | #253 | Tragic 33.2% |
| Native Hawaiians | 0.7 /100 | #254 | Tragic 33.2% |
| Iroquois | 0.7 /100 | #255 | Tragic 33.2% |
| Nicaraguans | 0.6 /100 | #256 | Tragic 33.1% |
| Spanish Americans | 0.6 /100 | #257 | Tragic 33.1% |
| French American Indians | 0.6 /100 | #258 | Tragic 33.1% |
| Osage | 0.5 /100 | #259 | Tragic 33.0% |
Demographics Similar to Immigrants from Dominican Republic by Bachelor's Degree
In terms of bachelor's degree, the demographic groups most similar to Immigrants from Dominican Republic are Puget Sound Salish (30.7%, a difference of 0.10%), Immigrants from Haiti (30.6%, a difference of 0.16%), Immigrants from Guatemala (30.8%, a difference of 0.24%), Chippewa (30.6%, a difference of 0.41%), and Cape Verdean (30.9%, a difference of 0.63%).
| Demographics | Rating | Rank | Bachelor's Degree |
| Guatemalans | 0.1 /100 | #288 | Tragic 31.0% |
| Puerto Ricans | 0.1 /100 | #289 | Tragic 31.0% |
| Immigrants | Honduras | 0.1 /100 | #290 | Tragic 30.9% |
| Blacks/African Americans | 0.1 /100 | #291 | Tragic 30.9% |
| Ute | 0.1 /100 | #292 | Tragic 30.9% |
| Cape Verdeans | 0.1 /100 | #293 | Tragic 30.9% |
| Immigrants | Guatemala | 0.0 /100 | #294 | Tragic 30.8% |
| Immigrants | Dominican Republic | 0.0 /100 | #295 | Tragic 30.7% |
| Puget Sound Salish | 0.0 /100 | #296 | Tragic 30.7% |
| Immigrants | Haiti | 0.0 /100 | #297 | Tragic 30.6% |
| Chippewa | 0.0 /100 | #298 | Tragic 30.6% |
| Chickasaw | 0.0 /100 | #299 | Tragic 30.4% |
| Immigrants | Micronesia | 0.0 /100 | #300 | Tragic 30.4% |
| Immigrants | Cuba | 0.0 /100 | #301 | Tragic 30.3% |
| Mexican American Indians | 0.0 /100 | #302 | Tragic 30.2% |