Immigrants from Bahamas vs Immigrants from Dominican Republic Householder Income Ages 45 - 64 years
COMPARE
Immigrants from Bahamas
Immigrants from Dominican Republic
Householder Income Ages 45 - 64 years
Householder Income Ages 45 - 64 years Comparison
Immigrants from Bahamas
Immigrants from Dominican Republic
$83,177
HOUSEHOLDER INCOME AGES 45 - 64 YEARS
0.0/ 100
METRIC RATING
311th/ 347
METRIC RANK
$78,836
HOUSEHOLDER INCOME AGES 45 - 64 YEARS
0.0/ 100
METRIC RATING
331st/ 347
METRIC RANK
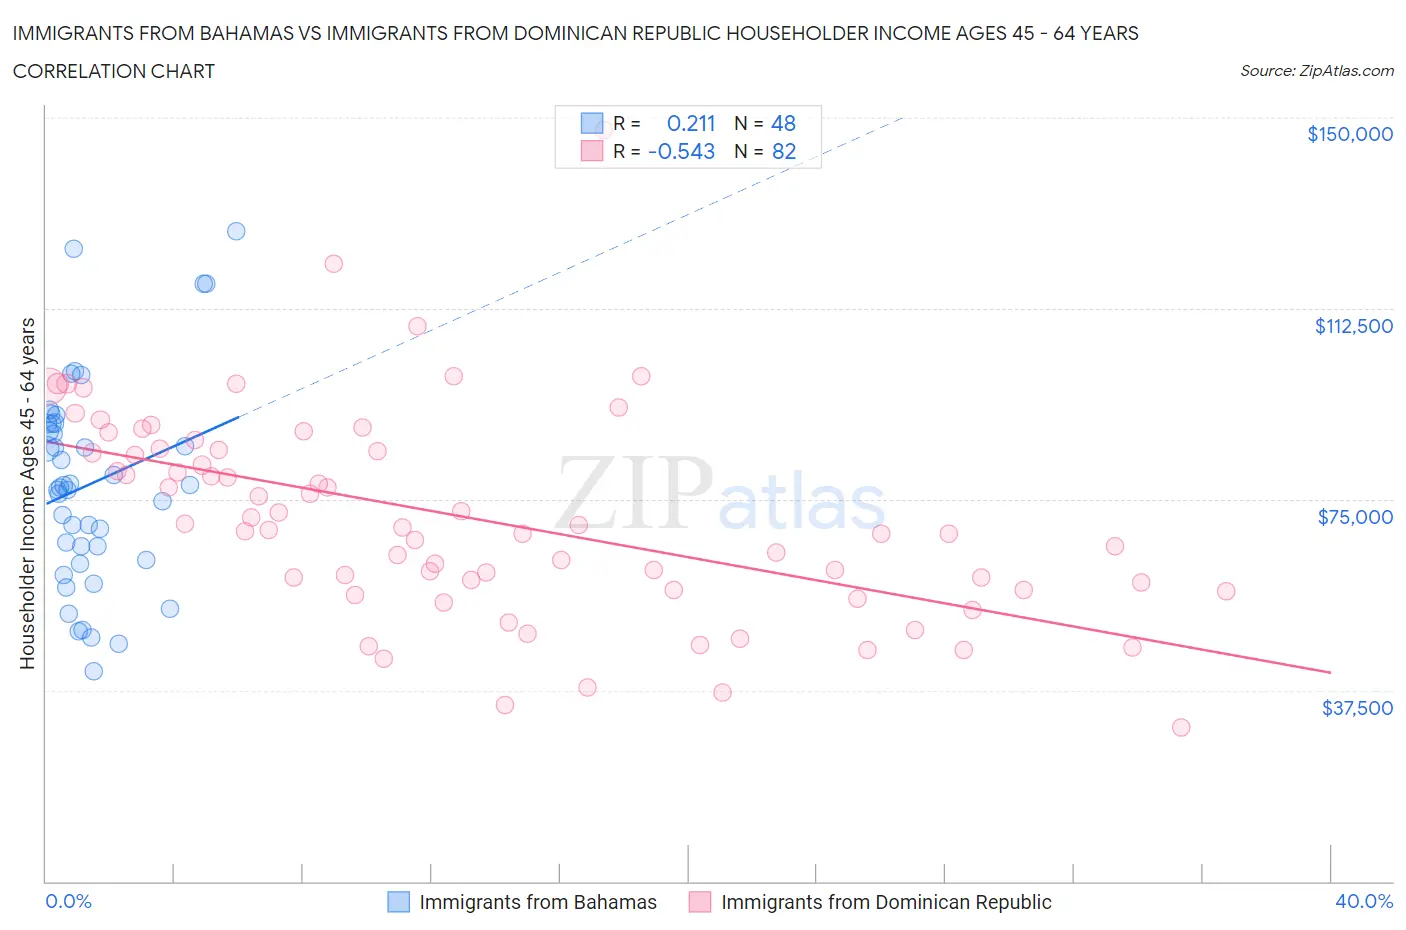
Immigrants from Bahamas vs Immigrants from Dominican Republic Householder Income Ages 45 - 64 years Correlation Chart
The statistical analysis conducted on geographies consisting of 104,531,402 people shows a weak positive correlation between the proportion of Immigrants from Bahamas and household income with householder between the ages 45 and 64 in the United States with a correlation coefficient (R) of 0.211 and weighted average of $83,177. Similarly, the statistical analysis conducted on geographies consisting of 274,687,311 people shows a substantial negative correlation between the proportion of Immigrants from Dominican Republic and household income with householder between the ages 45 and 64 in the United States with a correlation coefficient (R) of -0.543 and weighted average of $78,836, a difference of 5.5%.
Householder Income Ages 45 - 64 years Correlation Summary
| Measurement | Immigrants from Bahamas | Immigrants from Dominican Republic |
| Minimum | $41,195 | $30,156 |
| Maximum | $127,688 | $147,500 |
| Range | $86,493 | $117,344 |
| Mean | $78,060 | $71,398 |
| Median | $77,570 | $69,228 |
| Interquartile 25% (IQ1) | $64,406 | $57,193 |
| Interquartile 75% (IQ3) | $89,869 | $84,653 |
| Interquartile Range (IQR) | $25,463 | $27,460 |
| Standard Deviation (Sample) | $20,104 | $20,395 |
| Standard Deviation (Population) | $19,893 | $20,271 |
Demographics Similar to Immigrants from Bahamas and Immigrants from Dominican Republic by Householder Income Ages 45 - 64 years
In terms of householder income ages 45 - 64 years, the demographic groups most similar to Immigrants from Bahamas are Cajun ($83,015, a difference of 0.20%), U.S. Virgin Islander ($82,736, a difference of 0.53%), Immigrants from Honduras ($82,697, a difference of 0.58%), Paiute ($82,629, a difference of 0.66%), and Immigrants from Caribbean ($82,513, a difference of 0.81%). Similarly, the demographic groups most similar to Immigrants from Dominican Republic are Creek ($78,960, a difference of 0.16%), Dutch West Indian ($79,171, a difference of 0.42%), Native/Alaskan ($79,816, a difference of 1.2%), Seminole ($80,077, a difference of 1.6%), and Dominican ($80,623, a difference of 2.3%).
| Demographics | Rating | Rank | Householder Income Ages 45 - 64 years |
| Immigrants | Bahamas | 0.0 /100 | #311 | Tragic $83,177 |
| Cajuns | 0.0 /100 | #312 | Tragic $83,015 |
| U.S. Virgin Islanders | 0.0 /100 | #313 | Tragic $82,736 |
| Immigrants | Honduras | 0.0 /100 | #314 | Tragic $82,697 |
| Paiute | 0.0 /100 | #315 | Tragic $82,629 |
| Immigrants | Caribbean | 0.0 /100 | #316 | Tragic $82,513 |
| Colville | 0.0 /100 | #317 | Tragic $82,474 |
| Choctaw | 0.0 /100 | #318 | Tragic $82,287 |
| Chickasaw | 0.0 /100 | #319 | Tragic $82,193 |
| Apache | 0.0 /100 | #320 | Tragic $82,184 |
| Yuman | 0.0 /100 | #321 | Tragic $82,139 |
| Sioux | 0.0 /100 | #322 | Tragic $81,750 |
| Bahamians | 0.0 /100 | #323 | Tragic $81,369 |
| Yup'ik | 0.0 /100 | #324 | Tragic $81,000 |
| Immigrants | Cuba | 0.0 /100 | #325 | Tragic $80,662 |
| Dominicans | 0.0 /100 | #326 | Tragic $80,623 |
| Seminole | 0.0 /100 | #327 | Tragic $80,077 |
| Natives/Alaskans | 0.0 /100 | #328 | Tragic $79,816 |
| Dutch West Indians | 0.0 /100 | #329 | Tragic $79,171 |
| Creek | 0.0 /100 | #330 | Tragic $78,960 |
| Immigrants | Dominican Republic | 0.0 /100 | #331 | Tragic $78,836 |