Immigrants from Bahamas vs Immigrants from Dominican Republic In Labor Force | Age 25-29
COMPARE
Immigrants from Bahamas
Immigrants from Dominican Republic
In Labor Force | Age 25-29
In Labor Force | Age 25-29 Comparison
Immigrants from Bahamas
Immigrants from Dominican Republic
83.6%
IN LABOR FORCE | AGE 25-29
0.1/ 100
METRIC RATING
260th/ 347
METRIC RANK
83.1%
IN LABOR FORCE | AGE 25-29
0.0/ 100
METRIC RATING
281st/ 347
METRIC RANK
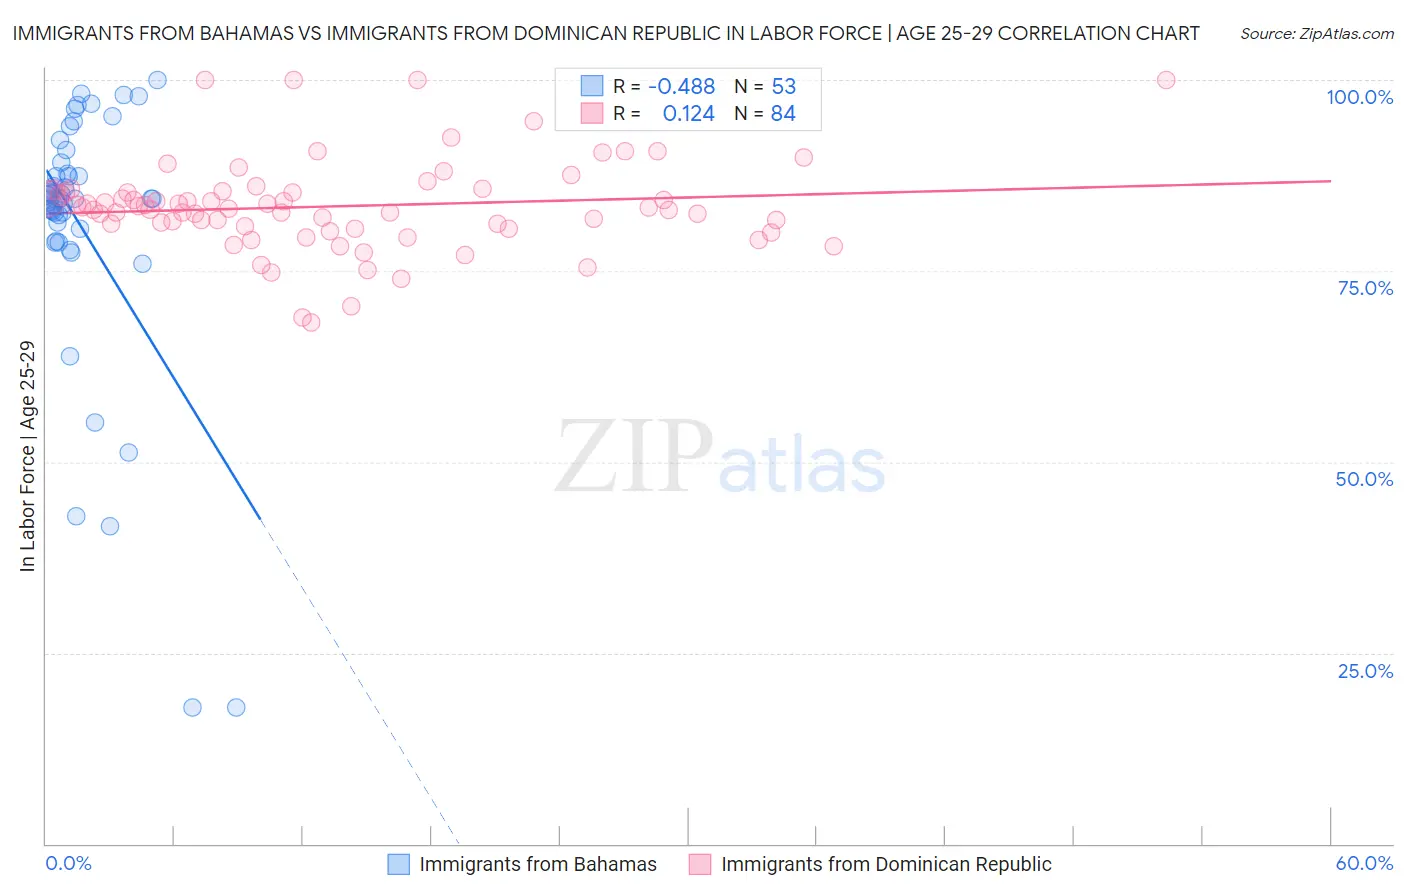
Immigrants from Bahamas vs Immigrants from Dominican Republic In Labor Force | Age 25-29 Correlation Chart
The statistical analysis conducted on geographies consisting of 104,655,808 people shows a moderate negative correlation between the proportion of Immigrants from Bahamas and labor force participation rate among population between the ages 25 and 29 in the United States with a correlation coefficient (R) of -0.488 and weighted average of 83.6%. Similarly, the statistical analysis conducted on geographies consisting of 275,085,250 people shows a poor positive correlation between the proportion of Immigrants from Dominican Republic and labor force participation rate among population between the ages 25 and 29 in the United States with a correlation coefficient (R) of 0.124 and weighted average of 83.1%, a difference of 0.59%.
In Labor Force | Age 25-29 Correlation Summary
| Measurement | Immigrants from Bahamas | Immigrants from Dominican Republic |
| Minimum | 17.9% | 68.3% |
| Maximum | 100.0% | 100.0% |
| Range | 82.1% | 31.7% |
| Mean | 80.7% | 83.5% |
| Median | 84.4% | 83.2% |
| Interquartile 25% (IQ1) | 79.7% | 80.7% |
| Interquartile 75% (IQ3) | 88.5% | 85.3% |
| Interquartile Range (IQR) | 8.8% | 4.6% |
| Standard Deviation (Sample) | 17.6% | 6.0% |
| Standard Deviation (Population) | 17.4% | 6.0% |
Similar Demographics by In Labor Force | Age 25-29
Demographics Similar to Immigrants from Bahamas by In Labor Force | Age 25-29
In terms of in labor force | age 25-29, the demographic groups most similar to Immigrants from Bahamas are Pennsylvania German (83.6%, a difference of 0.0%), Spanish (83.6%, a difference of 0.010%), Immigrants from Guatemala (83.6%, a difference of 0.020%), Immigrants from Haiti (83.7%, a difference of 0.060%), and Delaware (83.7%, a difference of 0.060%).
| Demographics | Rating | Rank | In Labor Force | Age 25-29 |
| Immigrants | Trinidad and Tobago | 0.2 /100 | #253 | Tragic 83.7% |
| Spaniards | 0.2 /100 | #254 | Tragic 83.7% |
| Haitians | 0.2 /100 | #255 | Tragic 83.7% |
| Immigrants | Haiti | 0.2 /100 | #256 | Tragic 83.7% |
| Delaware | 0.2 /100 | #257 | Tragic 83.7% |
| Immigrants | Guatemala | 0.1 /100 | #258 | Tragic 83.6% |
| Spanish | 0.1 /100 | #259 | Tragic 83.6% |
| Immigrants | Bahamas | 0.1 /100 | #260 | Tragic 83.6% |
| Pennsylvania Germans | 0.1 /100 | #261 | Tragic 83.6% |
| Immigrants | Fiji | 0.1 /100 | #262 | Tragic 83.6% |
| West Indians | 0.1 /100 | #263 | Tragic 83.5% |
| Puget Sound Salish | 0.1 /100 | #264 | Tragic 83.5% |
| Cubans | 0.1 /100 | #265 | Tragic 83.5% |
| Aleuts | 0.0 /100 | #266 | Tragic 83.4% |
| Spanish Americans | 0.0 /100 | #267 | Tragic 83.4% |
Demographics Similar to Immigrants from Dominican Republic by In Labor Force | Age 25-29
In terms of in labor force | age 25-29, the demographic groups most similar to Immigrants from Dominican Republic are American (83.1%, a difference of 0.010%), Immigrants from the Azores (83.1%, a difference of 0.010%), Nicaraguan (83.1%, a difference of 0.030%), Dominican (83.2%, a difference of 0.060%), and Belizean (83.1%, a difference of 0.070%).
| Demographics | Rating | Rank | In Labor Force | Age 25-29 |
| Marshallese | 0.0 /100 | #274 | Tragic 83.3% |
| Samoans | 0.0 /100 | #275 | Tragic 83.3% |
| Immigrants | Honduras | 0.0 /100 | #276 | Tragic 83.3% |
| Africans | 0.0 /100 | #277 | Tragic 83.2% |
| Immigrants | Cuba | 0.0 /100 | #278 | Tragic 83.2% |
| British West Indians | 0.0 /100 | #279 | Tragic 83.2% |
| Dominicans | 0.0 /100 | #280 | Tragic 83.2% |
| Immigrants | Dominican Republic | 0.0 /100 | #281 | Tragic 83.1% |
| Americans | 0.0 /100 | #282 | Tragic 83.1% |
| Immigrants | Azores | 0.0 /100 | #283 | Tragic 83.1% |
| Nicaraguans | 0.0 /100 | #284 | Tragic 83.1% |
| Belizeans | 0.0 /100 | #285 | Tragic 83.1% |
| Mexican American Indians | 0.0 /100 | #286 | Tragic 83.0% |
| Guyanese | 0.0 /100 | #287 | Tragic 83.0% |
| Ottawa | 0.0 /100 | #288 | Tragic 83.0% |