Immigrants from the Azores vs Jordanian Child Poverty Under the Age of 5
COMPARE
Immigrants from the Azores
Jordanian
Child Poverty Under the Age of 5
Child Poverty Under the Age of 5 Comparison
Immigrants from the Azores
Jordanians
18.9%
CHILD POVERTY UNDER THE AGE OF 5
2.6/ 100
METRIC RATING
220th/ 347
METRIC RANK
15.6%
CHILD POVERTY UNDER THE AGE OF 5
97.3/ 100
METRIC RATING
88th/ 347
METRIC RANK
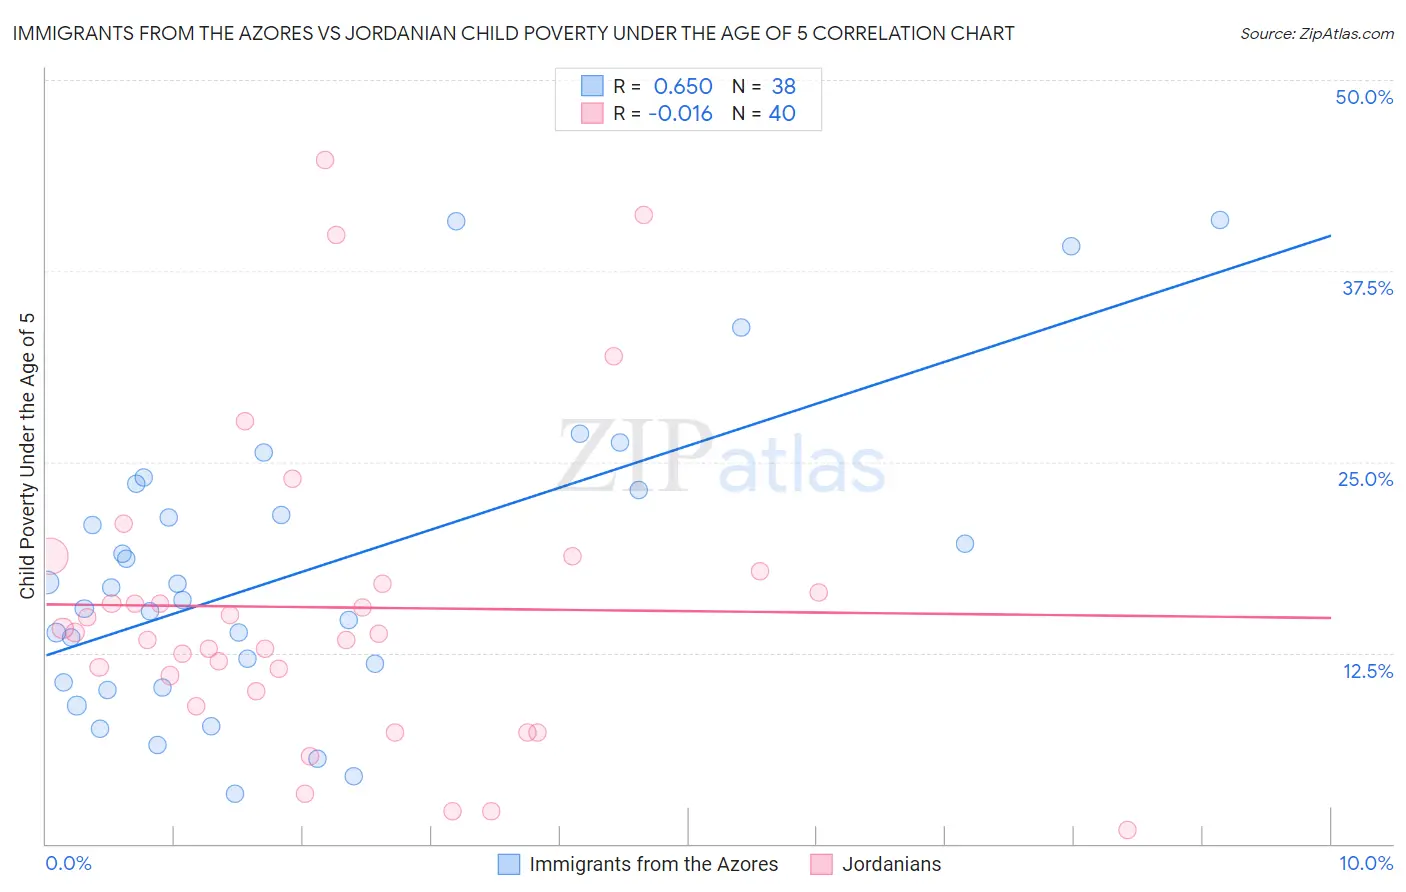
Immigrants from the Azores vs Jordanian Child Poverty Under the Age of 5 Correlation Chart
The statistical analysis conducted on geographies consisting of 45,317,352 people shows a significant positive correlation between the proportion of Immigrants from the Azores and poverty level among children under the age of 5 in the United States with a correlation coefficient (R) of 0.650 and weighted average of 18.9%. Similarly, the statistical analysis conducted on geographies consisting of 163,681,474 people shows no correlation between the proportion of Jordanians and poverty level among children under the age of 5 in the United States with a correlation coefficient (R) of -0.016 and weighted average of 15.6%, a difference of 20.6%.
Child Poverty Under the Age of 5 Correlation Summary
| Measurement | Immigrants from the Azores | Jordanian |
| Minimum | 3.3% | 0.93% |
| Maximum | 40.8% | 44.7% |
| Range | 37.5% | 43.8% |
| Mean | 17.8% | 15.5% |
| Median | 16.4% | 13.8% |
| Interquartile 25% (IQ1) | 10.6% | 10.5% |
| Interquartile 75% (IQ3) | 23.2% | 17.5% |
| Interquartile Range (IQR) | 12.6% | 7.0% |
| Standard Deviation (Sample) | 9.6% | 9.9% |
| Standard Deviation (Population) | 9.4% | 9.8% |
Similar Demographics by Child Poverty Under the Age of 5
Demographics Similar to Immigrants from the Azores by Child Poverty Under the Age of 5
In terms of child poverty under the age of 5, the demographic groups most similar to Immigrants from the Azores are German Russian (18.8%, a difference of 0.36%), Immigrants from Nigeria (19.0%, a difference of 0.56%), Delaware (18.7%, a difference of 0.67%), Alsatian (19.1%, a difference of 1.1%), and Cuban (19.1%, a difference of 1.1%).
| Demographics | Rating | Rank | Child Poverty Under the Age of 5 |
| Immigrants | Thailand | 8.6 /100 | #213 | Tragic 18.3% |
| Malaysians | 6.5 /100 | #214 | Tragic 18.4% |
| Immigrants | Panama | 6.0 /100 | #215 | Tragic 18.5% |
| Hmong | 5.0 /100 | #216 | Tragic 18.5% |
| Immigrants | Africa | 4.6 /100 | #217 | Tragic 18.6% |
| Delaware | 3.4 /100 | #218 | Tragic 18.7% |
| German Russians | 3.0 /100 | #219 | Tragic 18.8% |
| Immigrants | Azores | 2.6 /100 | #220 | Tragic 18.9% |
| Immigrants | Nigeria | 2.1 /100 | #221 | Tragic 19.0% |
| Alsatians | 1.7 /100 | #222 | Tragic 19.1% |
| Cubans | 1.7 /100 | #223 | Tragic 19.1% |
| Nicaraguans | 1.6 /100 | #224 | Tragic 19.1% |
| Nigerians | 1.6 /100 | #225 | Tragic 19.1% |
| Immigrants | Eritrea | 1.5 /100 | #226 | Tragic 19.1% |
| Cape Verdeans | 1.4 /100 | #227 | Tragic 19.1% |
Demographics Similar to Jordanians by Child Poverty Under the Age of 5
In terms of child poverty under the age of 5, the demographic groups most similar to Jordanians are Immigrants from Vietnam (15.6%, a difference of 0.050%), Immigrants from Croatia (15.6%, a difference of 0.060%), Immigrants from France (15.6%, a difference of 0.060%), Immigrants from Malaysia (15.6%, a difference of 0.13%), and Immigrants from Latvia (15.6%, a difference of 0.14%).
| Demographics | Rating | Rank | Child Poverty Under the Age of 5 |
| Czechs | 97.8 /100 | #81 | Exceptional 15.5% |
| Immigrants | Italy | 97.7 /100 | #82 | Exceptional 15.6% |
| Chileans | 97.6 /100 | #83 | Exceptional 15.6% |
| Immigrants | Netherlands | 97.6 /100 | #84 | Exceptional 15.6% |
| Immigrants | Latvia | 97.4 /100 | #85 | Exceptional 15.6% |
| Immigrants | Malaysia | 97.4 /100 | #86 | Exceptional 15.6% |
| Immigrants | Vietnam | 97.4 /100 | #87 | Exceptional 15.6% |
| Jordanians | 97.3 /100 | #88 | Exceptional 15.6% |
| Immigrants | Croatia | 97.3 /100 | #89 | Exceptional 15.6% |
| Immigrants | France | 97.3 /100 | #90 | Exceptional 15.6% |
| Poles | 97.2 /100 | #91 | Exceptional 15.7% |
| Scandinavians | 97.1 /100 | #92 | Exceptional 15.7% |
| Ukrainians | 97.1 /100 | #93 | Exceptional 15.7% |
| Immigrants | South Eastern Asia | 97.1 /100 | #94 | Exceptional 15.7% |
| Immigrants | Switzerland | 96.4 /100 | #95 | Exceptional 15.8% |