Immigrants from the Azores vs Australian Child Poverty Under the Age of 5
COMPARE
Immigrants from the Azores
Australian
Child Poverty Under the Age of 5
Child Poverty Under the Age of 5 Comparison
Immigrants from the Azores
Australians
18.9%
CHILD POVERTY UNDER THE AGE OF 5
2.6/ 100
METRIC RATING
220th/ 347
METRIC RANK
15.5%
CHILD POVERTY UNDER THE AGE OF 5
98.0/ 100
METRIC RATING
79th/ 347
METRIC RANK
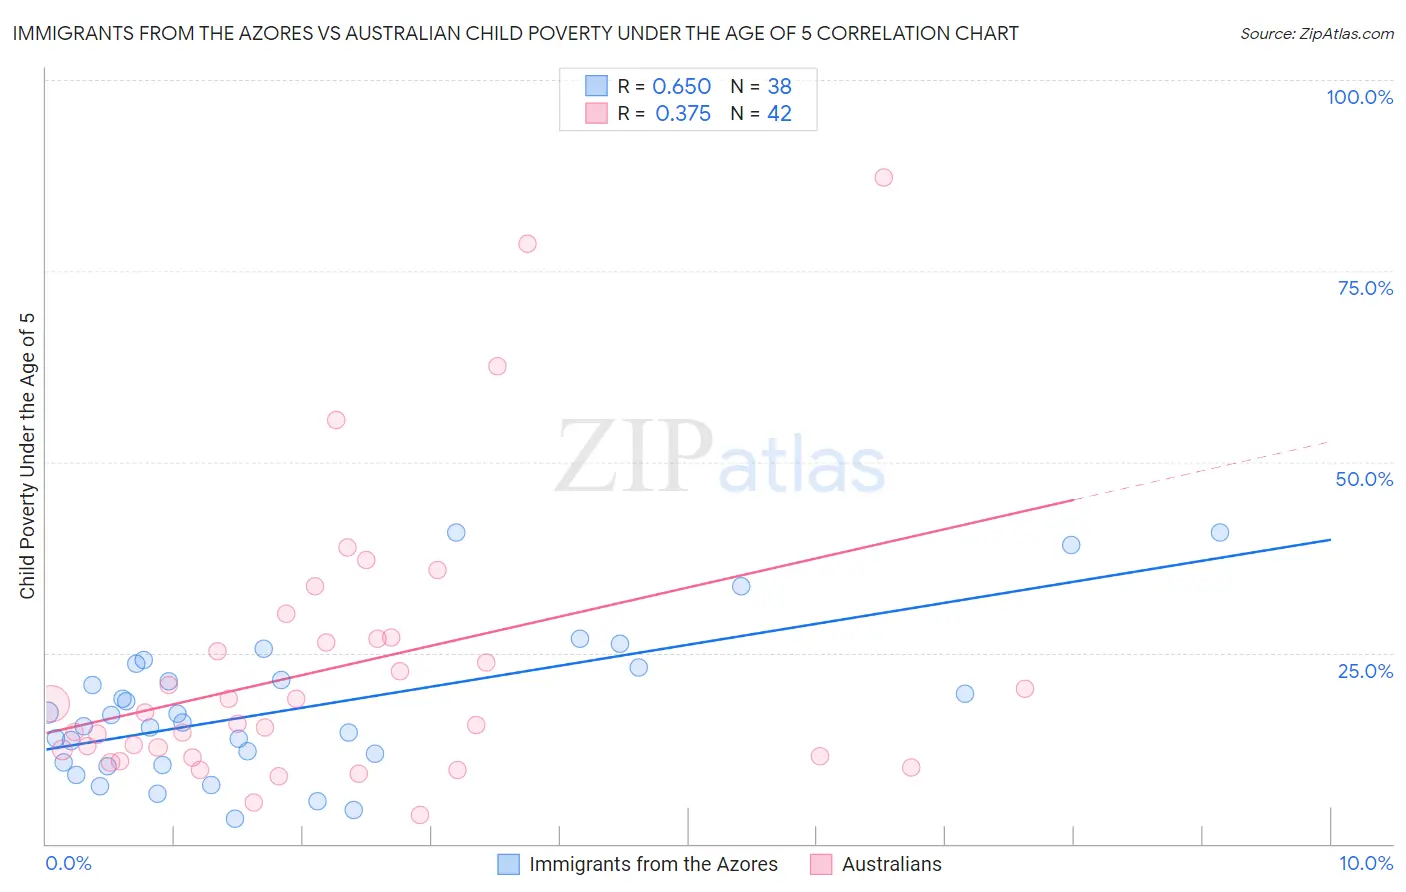
Immigrants from the Azores vs Australian Child Poverty Under the Age of 5 Correlation Chart
The statistical analysis conducted on geographies consisting of 45,317,352 people shows a significant positive correlation between the proportion of Immigrants from the Azores and poverty level among children under the age of 5 in the United States with a correlation coefficient (R) of 0.650 and weighted average of 18.9%. Similarly, the statistical analysis conducted on geographies consisting of 216,887,244 people shows a mild positive correlation between the proportion of Australians and poverty level among children under the age of 5 in the United States with a correlation coefficient (R) of 0.375 and weighted average of 15.5%, a difference of 21.6%.
Child Poverty Under the Age of 5 Correlation Summary
| Measurement | Immigrants from the Azores | Australian |
| Minimum | 3.3% | 3.7% |
| Maximum | 40.8% | 87.2% |
| Range | 37.5% | 83.5% |
| Mean | 17.8% | 23.0% |
| Median | 16.4% | 16.5% |
| Interquartile 25% (IQ1) | 10.6% | 11.4% |
| Interquartile 75% (IQ3) | 23.2% | 26.9% |
| Interquartile Range (IQR) | 12.6% | 15.5% |
| Standard Deviation (Sample) | 9.6% | 18.3% |
| Standard Deviation (Population) | 9.4% | 18.1% |
Similar Demographics by Child Poverty Under the Age of 5
Demographics Similar to Immigrants from the Azores by Child Poverty Under the Age of 5
In terms of child poverty under the age of 5, the demographic groups most similar to Immigrants from the Azores are German Russian (18.8%, a difference of 0.36%), Immigrants from Nigeria (19.0%, a difference of 0.56%), Delaware (18.7%, a difference of 0.67%), Alsatian (19.1%, a difference of 1.1%), and Cuban (19.1%, a difference of 1.1%).
| Demographics | Rating | Rank | Child Poverty Under the Age of 5 |
| Immigrants | Thailand | 8.6 /100 | #213 | Tragic 18.3% |
| Malaysians | 6.5 /100 | #214 | Tragic 18.4% |
| Immigrants | Panama | 6.0 /100 | #215 | Tragic 18.5% |
| Hmong | 5.0 /100 | #216 | Tragic 18.5% |
| Immigrants | Africa | 4.6 /100 | #217 | Tragic 18.6% |
| Delaware | 3.4 /100 | #218 | Tragic 18.7% |
| German Russians | 3.0 /100 | #219 | Tragic 18.8% |
| Immigrants | Azores | 2.6 /100 | #220 | Tragic 18.9% |
| Immigrants | Nigeria | 2.1 /100 | #221 | Tragic 19.0% |
| Alsatians | 1.7 /100 | #222 | Tragic 19.1% |
| Cubans | 1.7 /100 | #223 | Tragic 19.1% |
| Nicaraguans | 1.6 /100 | #224 | Tragic 19.1% |
| Nigerians | 1.6 /100 | #225 | Tragic 19.1% |
| Immigrants | Eritrea | 1.5 /100 | #226 | Tragic 19.1% |
| Cape Verdeans | 1.4 /100 | #227 | Tragic 19.1% |
Demographics Similar to Australians by Child Poverty Under the Age of 5
In terms of child poverty under the age of 5, the demographic groups most similar to Australians are Italian (15.5%, a difference of 0.11%), Czech (15.5%, a difference of 0.23%), Sri Lankan (15.5%, a difference of 0.25%), Immigrants from Italy (15.6%, a difference of 0.37%), and Chilean (15.6%, a difference of 0.53%).
| Demographics | Rating | Rank | Child Poverty Under the Age of 5 |
| Immigrants | Sweden | 98.8 /100 | #72 | Exceptional 15.3% |
| Immigrants | Ukraine | 98.7 /100 | #73 | Exceptional 15.3% |
| Argentineans | 98.5 /100 | #74 | Exceptional 15.4% |
| Immigrants | Argentina | 98.5 /100 | #75 | Exceptional 15.4% |
| Croatians | 98.5 /100 | #76 | Exceptional 15.4% |
| Immigrants | Turkey | 98.3 /100 | #77 | Exceptional 15.4% |
| Sri Lankans | 98.1 /100 | #78 | Exceptional 15.5% |
| Australians | 98.0 /100 | #79 | Exceptional 15.5% |
| Italians | 97.9 /100 | #80 | Exceptional 15.5% |
| Czechs | 97.8 /100 | #81 | Exceptional 15.5% |
| Immigrants | Italy | 97.7 /100 | #82 | Exceptional 15.6% |
| Chileans | 97.6 /100 | #83 | Exceptional 15.6% |
| Immigrants | Netherlands | 97.6 /100 | #84 | Exceptional 15.6% |
| Immigrants | Latvia | 97.4 /100 | #85 | Exceptional 15.6% |
| Immigrants | Malaysia | 97.4 /100 | #86 | Exceptional 15.6% |