Eastern European vs Jordanian Child Poverty Under the Age of 5
COMPARE
Eastern European
Jordanian
Child Poverty Under the Age of 5
Child Poverty Under the Age of 5 Comparison
Eastern Europeans
Jordanians
14.6%
CHILD POVERTY UNDER THE AGE OF 5
99.7/ 100
METRIC RATING
38th/ 347
METRIC RANK
15.6%
CHILD POVERTY UNDER THE AGE OF 5
97.3/ 100
METRIC RATING
88th/ 347
METRIC RANK
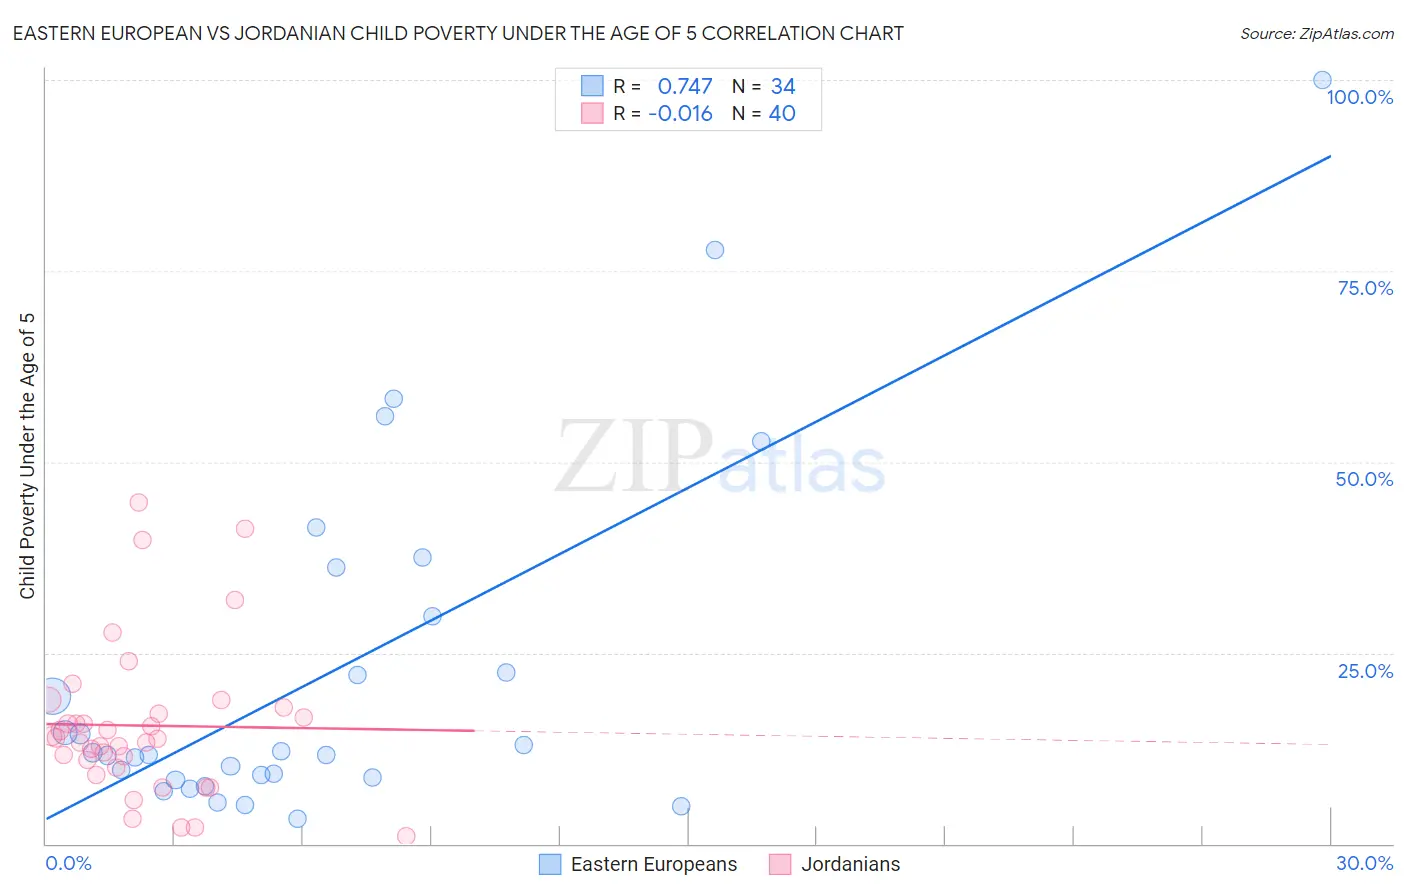
Eastern European vs Jordanian Child Poverty Under the Age of 5 Correlation Chart
The statistical analysis conducted on geographies consisting of 434,780,040 people shows a strong positive correlation between the proportion of Eastern Europeans and poverty level among children under the age of 5 in the United States with a correlation coefficient (R) of 0.747 and weighted average of 14.6%. Similarly, the statistical analysis conducted on geographies consisting of 163,681,474 people shows no correlation between the proportion of Jordanians and poverty level among children under the age of 5 in the United States with a correlation coefficient (R) of -0.016 and weighted average of 15.6%, a difference of 7.0%.
Child Poverty Under the Age of 5 Correlation Summary
| Measurement | Eastern European | Jordanian |
| Minimum | 3.2% | 0.93% |
| Maximum | 100.0% | 44.7% |
| Range | 96.8% | 43.8% |
| Mean | 22.4% | 15.5% |
| Median | 11.7% | 13.8% |
| Interquartile 25% (IQ1) | 8.7% | 10.5% |
| Interquartile 75% (IQ3) | 29.8% | 17.5% |
| Interquartile Range (IQR) | 21.0% | 7.0% |
| Standard Deviation (Sample) | 22.8% | 9.9% |
| Standard Deviation (Population) | 22.5% | 9.8% |
Similar Demographics by Child Poverty Under the Age of 5
Demographics Similar to Eastern Europeans by Child Poverty Under the Age of 5
In terms of child poverty under the age of 5, the demographic groups most similar to Eastern Europeans are Norwegian (14.6%, a difference of 0.0%), Turkish (14.6%, a difference of 0.27%), Immigrants from Australia (14.6%, a difference of 0.29%), Immigrants from Belarus (14.7%, a difference of 0.41%), and Soviet Union (14.7%, a difference of 0.57%).
| Demographics | Rating | Rank | Child Poverty Under the Age of 5 |
| Koreans | 99.8 /100 | #31 | Exceptional 14.4% |
| Immigrants | Sri Lanka | 99.8 /100 | #32 | Exceptional 14.4% |
| Taiwanese | 99.8 /100 | #33 | Exceptional 14.5% |
| Immigrants | Moldova | 99.8 /100 | #34 | Exceptional 14.5% |
| Latvians | 99.8 /100 | #35 | Exceptional 14.5% |
| Maltese | 99.8 /100 | #36 | Exceptional 14.5% |
| Turks | 99.7 /100 | #37 | Exceptional 14.6% |
| Eastern Europeans | 99.7 /100 | #38 | Exceptional 14.6% |
| Norwegians | 99.7 /100 | #39 | Exceptional 14.6% |
| Immigrants | Australia | 99.7 /100 | #40 | Exceptional 14.6% |
| Immigrants | Belarus | 99.7 /100 | #41 | Exceptional 14.7% |
| Soviet Union | 99.7 /100 | #42 | Exceptional 14.7% |
| Immigrants | Greece | 99.7 /100 | #43 | Exceptional 14.7% |
| Immigrants | Philippines | 99.7 /100 | #44 | Exceptional 14.7% |
| Laotians | 99.6 /100 | #45 | Exceptional 14.7% |
Demographics Similar to Jordanians by Child Poverty Under the Age of 5
In terms of child poverty under the age of 5, the demographic groups most similar to Jordanians are Immigrants from Vietnam (15.6%, a difference of 0.050%), Immigrants from Croatia (15.6%, a difference of 0.060%), Immigrants from France (15.6%, a difference of 0.060%), Immigrants from Malaysia (15.6%, a difference of 0.13%), and Immigrants from Latvia (15.6%, a difference of 0.14%).
| Demographics | Rating | Rank | Child Poverty Under the Age of 5 |
| Czechs | 97.8 /100 | #81 | Exceptional 15.5% |
| Immigrants | Italy | 97.7 /100 | #82 | Exceptional 15.6% |
| Chileans | 97.6 /100 | #83 | Exceptional 15.6% |
| Immigrants | Netherlands | 97.6 /100 | #84 | Exceptional 15.6% |
| Immigrants | Latvia | 97.4 /100 | #85 | Exceptional 15.6% |
| Immigrants | Malaysia | 97.4 /100 | #86 | Exceptional 15.6% |
| Immigrants | Vietnam | 97.4 /100 | #87 | Exceptional 15.6% |
| Jordanians | 97.3 /100 | #88 | Exceptional 15.6% |
| Immigrants | Croatia | 97.3 /100 | #89 | Exceptional 15.6% |
| Immigrants | France | 97.3 /100 | #90 | Exceptional 15.6% |
| Poles | 97.2 /100 | #91 | Exceptional 15.7% |
| Scandinavians | 97.1 /100 | #92 | Exceptional 15.7% |
| Ukrainians | 97.1 /100 | #93 | Exceptional 15.7% |
| Immigrants | South Eastern Asia | 97.1 /100 | #94 | Exceptional 15.7% |
| Immigrants | Switzerland | 96.4 /100 | #95 | Exceptional 15.8% |