Immigrants from the Azores vs Cypriot Child Poverty Under the Age of 5
COMPARE
Immigrants from the Azores
Cypriot
Child Poverty Under the Age of 5
Child Poverty Under the Age of 5 Comparison
Immigrants from the Azores
Cypriots
18.9%
CHILD POVERTY UNDER THE AGE OF 5
2.6/ 100
METRIC RATING
220th/ 347
METRIC RANK
14.0%
CHILD POVERTY UNDER THE AGE OF 5
99.9/ 100
METRIC RATING
25th/ 347
METRIC RANK
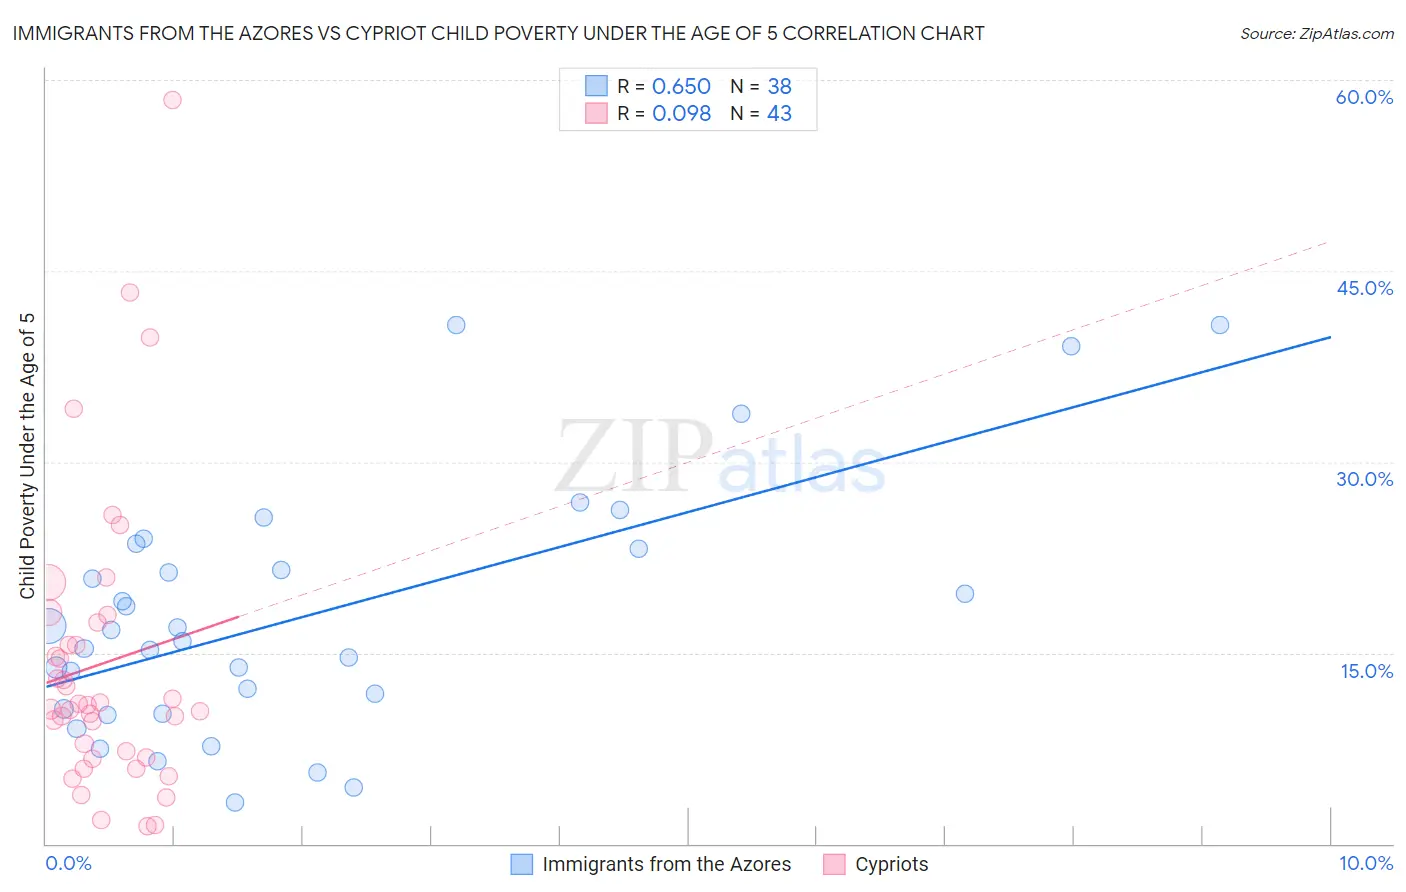
Immigrants from the Azores vs Cypriot Child Poverty Under the Age of 5 Correlation Chart
The statistical analysis conducted on geographies consisting of 45,317,352 people shows a significant positive correlation between the proportion of Immigrants from the Azores and poverty level among children under the age of 5 in the United States with a correlation coefficient (R) of 0.650 and weighted average of 18.9%. Similarly, the statistical analysis conducted on geographies consisting of 60,873,789 people shows a slight positive correlation between the proportion of Cypriots and poverty level among children under the age of 5 in the United States with a correlation coefficient (R) of 0.098 and weighted average of 14.0%, a difference of 35.0%.
Child Poverty Under the Age of 5 Correlation Summary
| Measurement | Immigrants from the Azores | Cypriot |
| Minimum | 3.3% | 1.4% |
| Maximum | 40.8% | 58.4% |
| Range | 37.5% | 57.0% |
| Mean | 17.8% | 14.2% |
| Median | 16.4% | 10.9% |
| Interquartile 25% (IQ1) | 10.6% | 6.8% |
| Interquartile 75% (IQ3) | 23.2% | 17.4% |
| Interquartile Range (IQR) | 12.6% | 10.6% |
| Standard Deviation (Sample) | 9.6% | 11.6% |
| Standard Deviation (Population) | 9.4% | 11.4% |
Similar Demographics by Child Poverty Under the Age of 5
Demographics Similar to Immigrants from the Azores by Child Poverty Under the Age of 5
In terms of child poverty under the age of 5, the demographic groups most similar to Immigrants from the Azores are German Russian (18.8%, a difference of 0.36%), Immigrants from Nigeria (19.0%, a difference of 0.56%), Delaware (18.7%, a difference of 0.67%), Alsatian (19.1%, a difference of 1.1%), and Cuban (19.1%, a difference of 1.1%).
| Demographics | Rating | Rank | Child Poverty Under the Age of 5 |
| Immigrants | Thailand | 8.6 /100 | #213 | Tragic 18.3% |
| Malaysians | 6.5 /100 | #214 | Tragic 18.4% |
| Immigrants | Panama | 6.0 /100 | #215 | Tragic 18.5% |
| Hmong | 5.0 /100 | #216 | Tragic 18.5% |
| Immigrants | Africa | 4.6 /100 | #217 | Tragic 18.6% |
| Delaware | 3.4 /100 | #218 | Tragic 18.7% |
| German Russians | 3.0 /100 | #219 | Tragic 18.8% |
| Immigrants | Azores | 2.6 /100 | #220 | Tragic 18.9% |
| Immigrants | Nigeria | 2.1 /100 | #221 | Tragic 19.0% |
| Alsatians | 1.7 /100 | #222 | Tragic 19.1% |
| Cubans | 1.7 /100 | #223 | Tragic 19.1% |
| Nicaraguans | 1.6 /100 | #224 | Tragic 19.1% |
| Nigerians | 1.6 /100 | #225 | Tragic 19.1% |
| Immigrants | Eritrea | 1.5 /100 | #226 | Tragic 19.1% |
| Cape Verdeans | 1.4 /100 | #227 | Tragic 19.1% |
Demographics Similar to Cypriots by Child Poverty Under the Age of 5
In terms of child poverty under the age of 5, the demographic groups most similar to Cypriots are Asian (14.0%, a difference of 0.0%), Bulgarian (13.9%, a difference of 0.52%), Immigrants from Lithuania (14.1%, a difference of 0.93%), Immigrants from Bolivia (13.8%, a difference of 0.96%), and Bolivian (13.8%, a difference of 1.0%).
| Demographics | Rating | Rank | Child Poverty Under the Age of 5 |
| Immigrants | China | 100.0 /100 | #18 | Exceptional 13.6% |
| Immigrants | Ireland | 100.0 /100 | #19 | Exceptional 13.7% |
| Immigrants | Japan | 100.0 /100 | #20 | Exceptional 13.8% |
| Bolivians | 100.0 /100 | #21 | Exceptional 13.8% |
| Immigrants | Bolivia | 100.0 /100 | #22 | Exceptional 13.8% |
| Bulgarians | 99.9 /100 | #23 | Exceptional 13.9% |
| Asians | 99.9 /100 | #24 | Exceptional 14.0% |
| Cypriots | 99.9 /100 | #25 | Exceptional 14.0% |
| Immigrants | Lithuania | 99.9 /100 | #26 | Exceptional 14.1% |
| Tongans | 99.9 /100 | #27 | Exceptional 14.2% |
| Immigrants | Indonesia | 99.8 /100 | #28 | Exceptional 14.3% |
| Immigrants | Asia | 99.8 /100 | #29 | Exceptional 14.4% |
| Cambodians | 99.8 /100 | #30 | Exceptional 14.4% |
| Koreans | 99.8 /100 | #31 | Exceptional 14.4% |
| Immigrants | Sri Lanka | 99.8 /100 | #32 | Exceptional 14.4% |