Immigrants from the Azores vs Immigrants from St. Vincent and the Grenadines Child Poverty Under the Age of 5
COMPARE
Immigrants from the Azores
Immigrants from St. Vincent and the Grenadines
Child Poverty Under the Age of 5
Child Poverty Under the Age of 5 Comparison
Immigrants from the Azores
Immigrants from St. Vincent and the Grenadines
18.9%
CHILD POVERTY UNDER THE AGE OF 5
2.6/ 100
METRIC RATING
220th/ 347
METRIC RANK
20.0%
CHILD POVERTY UNDER THE AGE OF 5
0.2/ 100
METRIC RATING
258th/ 347
METRIC RANK
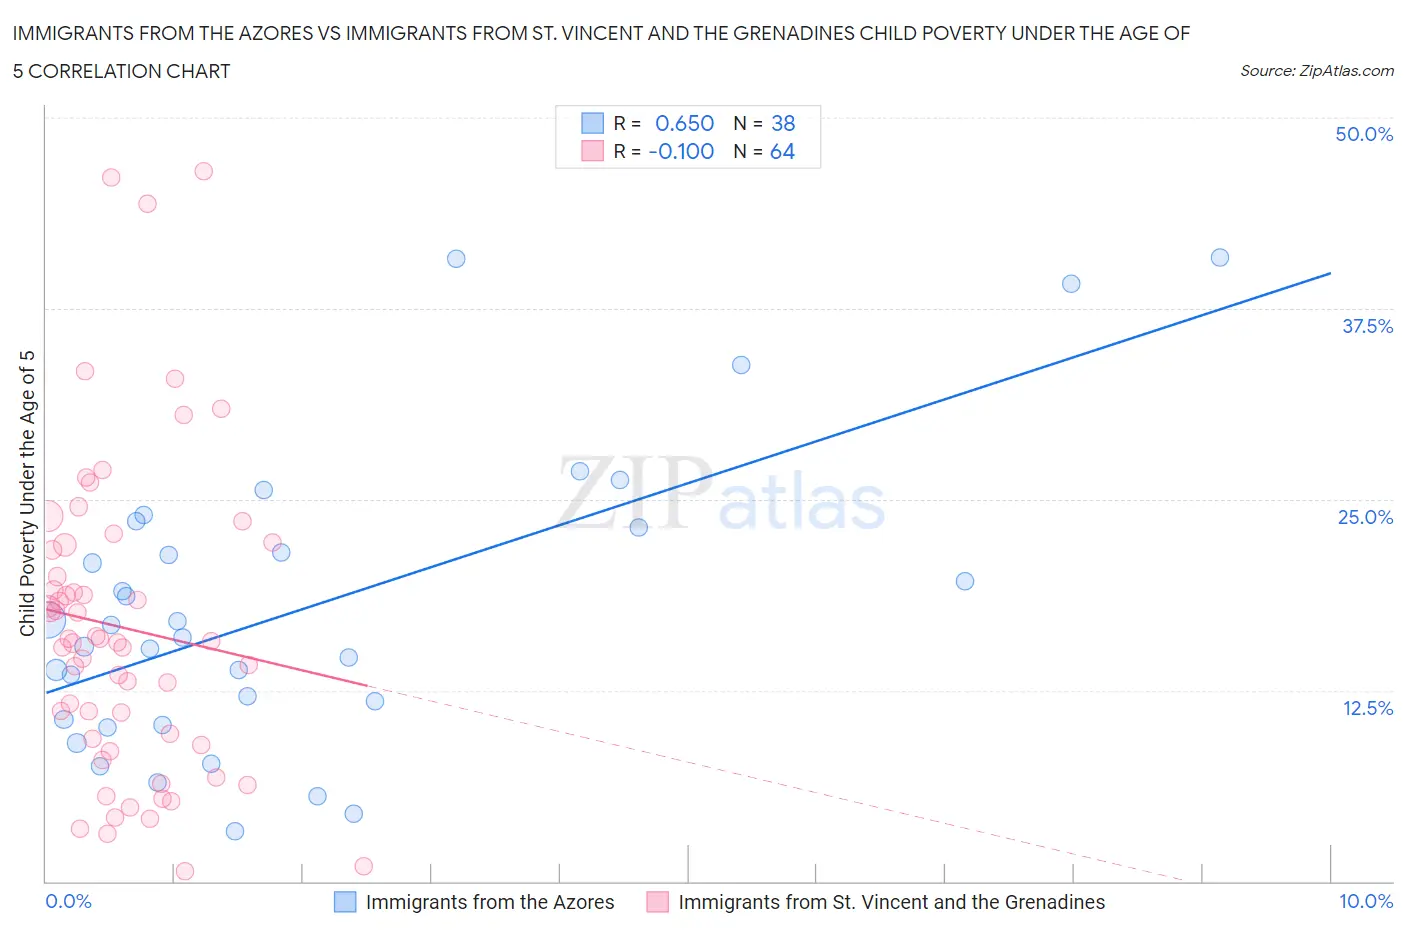
Immigrants from the Azores vs Immigrants from St. Vincent and the Grenadines Child Poverty Under the Age of 5 Correlation Chart
The statistical analysis conducted on geographies consisting of 45,317,352 people shows a significant positive correlation between the proportion of Immigrants from the Azores and poverty level among children under the age of 5 in the United States with a correlation coefficient (R) of 0.650 and weighted average of 18.9%. Similarly, the statistical analysis conducted on geographies consisting of 55,885,863 people shows a slight negative correlation between the proportion of Immigrants from St. Vincent and the Grenadines and poverty level among children under the age of 5 in the United States with a correlation coefficient (R) of -0.100 and weighted average of 20.0%, a difference of 6.1%.
Child Poverty Under the Age of 5 Correlation Summary
| Measurement | Immigrants from the Azores | Immigrants from St. Vincent and the Grenadines |
| Minimum | 3.3% | 0.65% |
| Maximum | 40.8% | 46.4% |
| Range | 37.5% | 45.8% |
| Mean | 17.8% | 16.6% |
| Median | 16.4% | 15.7% |
| Interquartile 25% (IQ1) | 10.6% | 9.1% |
| Interquartile 75% (IQ3) | 23.2% | 21.9% |
| Interquartile Range (IQR) | 12.6% | 12.8% |
| Standard Deviation (Sample) | 9.6% | 10.2% |
| Standard Deviation (Population) | 9.4% | 10.1% |
Similar Demographics by Child Poverty Under the Age of 5
Demographics Similar to Immigrants from the Azores by Child Poverty Under the Age of 5
In terms of child poverty under the age of 5, the demographic groups most similar to Immigrants from the Azores are German Russian (18.8%, a difference of 0.36%), Immigrants from Nigeria (19.0%, a difference of 0.56%), Delaware (18.7%, a difference of 0.67%), Alsatian (19.1%, a difference of 1.1%), and Cuban (19.1%, a difference of 1.1%).
| Demographics | Rating | Rank | Child Poverty Under the Age of 5 |
| Immigrants | Thailand | 8.6 /100 | #213 | Tragic 18.3% |
| Malaysians | 6.5 /100 | #214 | Tragic 18.4% |
| Immigrants | Panama | 6.0 /100 | #215 | Tragic 18.5% |
| Hmong | 5.0 /100 | #216 | Tragic 18.5% |
| Immigrants | Africa | 4.6 /100 | #217 | Tragic 18.6% |
| Delaware | 3.4 /100 | #218 | Tragic 18.7% |
| German Russians | 3.0 /100 | #219 | Tragic 18.8% |
| Immigrants | Azores | 2.6 /100 | #220 | Tragic 18.9% |
| Immigrants | Nigeria | 2.1 /100 | #221 | Tragic 19.0% |
| Alsatians | 1.7 /100 | #222 | Tragic 19.1% |
| Cubans | 1.7 /100 | #223 | Tragic 19.1% |
| Nicaraguans | 1.6 /100 | #224 | Tragic 19.1% |
| Nigerians | 1.6 /100 | #225 | Tragic 19.1% |
| Immigrants | Eritrea | 1.5 /100 | #226 | Tragic 19.1% |
| Cape Verdeans | 1.4 /100 | #227 | Tragic 19.1% |
Demographics Similar to Immigrants from St. Vincent and the Grenadines by Child Poverty Under the Age of 5
In terms of child poverty under the age of 5, the demographic groups most similar to Immigrants from St. Vincent and the Grenadines are Immigrants from El Salvador (20.0%, a difference of 0.030%), Shoshone (20.0%, a difference of 0.14%), Immigrants from Barbados (20.0%, a difference of 0.15%), Immigrants from Cuba (19.9%, a difference of 0.37%), and Spanish American (20.1%, a difference of 0.43%).
| Demographics | Rating | Rank | Child Poverty Under the Age of 5 |
| Pennsylvania Germans | 0.3 /100 | #251 | Tragic 19.8% |
| Immigrants | Nicaragua | 0.3 /100 | #252 | Tragic 19.8% |
| Mexican American Indians | 0.3 /100 | #253 | Tragic 19.9% |
| Fijians | 0.3 /100 | #254 | Tragic 19.9% |
| Immigrants | Cuba | 0.2 /100 | #255 | Tragic 19.9% |
| Immigrants | Barbados | 0.2 /100 | #256 | Tragic 20.0% |
| Shoshone | 0.2 /100 | #257 | Tragic 20.0% |
| Immigrants | St. Vincent and the Grenadines | 0.2 /100 | #258 | Tragic 20.0% |
| Immigrants | El Salvador | 0.2 /100 | #259 | Tragic 20.0% |
| Spanish Americans | 0.2 /100 | #260 | Tragic 20.1% |
| Immigrants | Bangladesh | 0.2 /100 | #261 | Tragic 20.1% |
| Liberians | 0.1 /100 | #262 | Tragic 20.2% |
| Barbadians | 0.1 /100 | #263 | Tragic 20.2% |
| Immigrants | Liberia | 0.1 /100 | #264 | Tragic 20.2% |
| Spanish American Indians | 0.1 /100 | #265 | Tragic 20.2% |