Immigrants from the Azores vs Jordanian Householder Income Ages 25 - 44 years
COMPARE
Immigrants from the Azores
Jordanian
Householder Income Ages 25 - 44 years
Householder Income Ages 25 - 44 years Comparison
Immigrants from the Azores
Jordanians
$92,322
HOUSEHOLDER INCOME AGES 25 - 44 YEARS
22.4/ 100
METRIC RATING
194th/ 347
METRIC RANK
$99,186
HOUSEHOLDER INCOME AGES 25 - 44 YEARS
92.8/ 100
METRIC RATING
119th/ 347
METRIC RANK
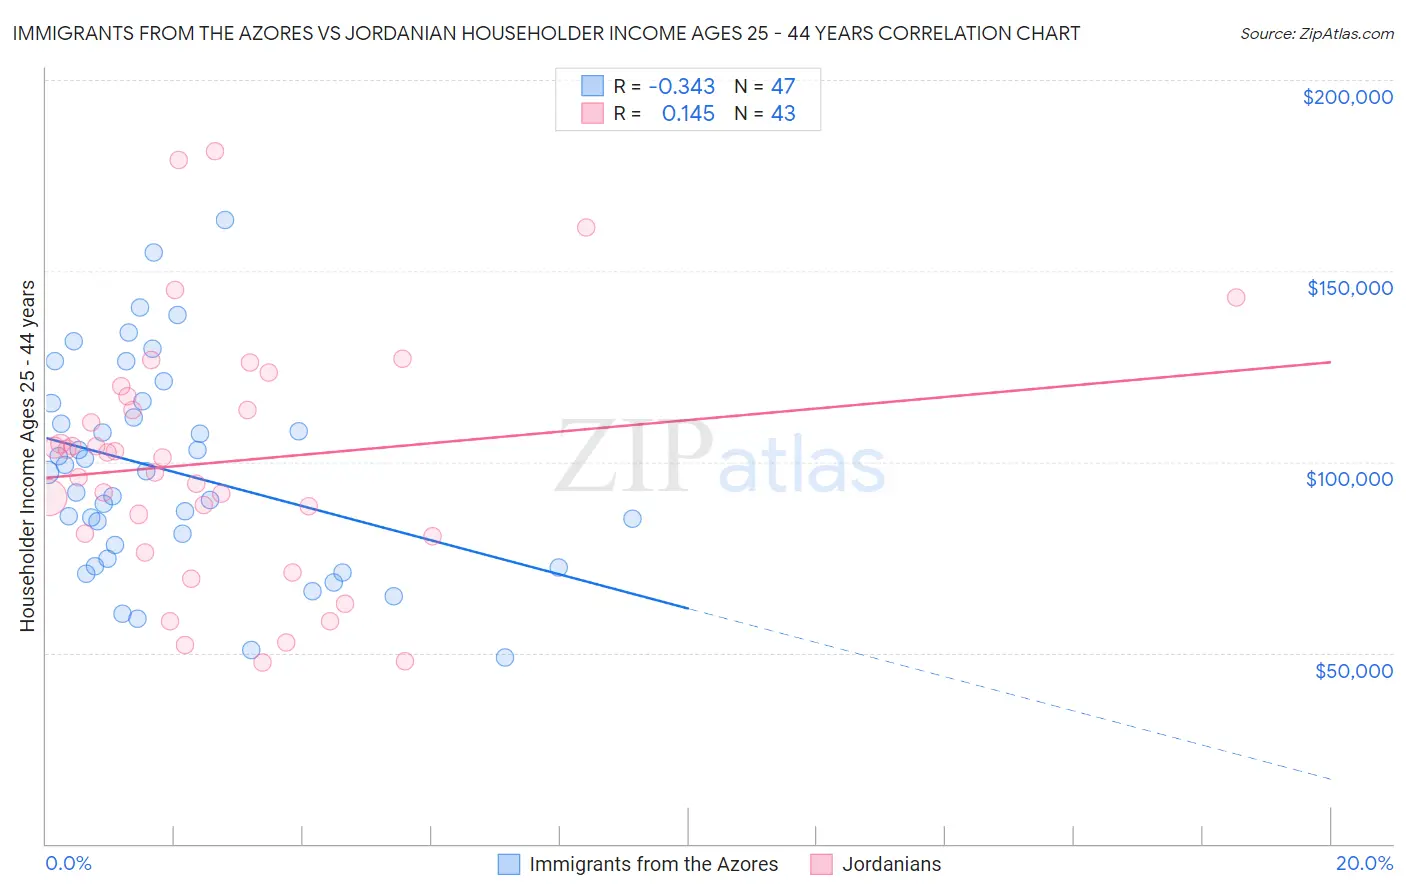
Immigrants from the Azores vs Jordanian Householder Income Ages 25 - 44 years Correlation Chart
The statistical analysis conducted on geographies consisting of 46,239,396 people shows a mild negative correlation between the proportion of Immigrants from the Azores and household income with householder between the ages 25 and 44 in the United States with a correlation coefficient (R) of -0.343 and weighted average of $92,322. Similarly, the statistical analysis conducted on geographies consisting of 166,327,979 people shows a poor positive correlation between the proportion of Jordanians and household income with householder between the ages 25 and 44 in the United States with a correlation coefficient (R) of 0.145 and weighted average of $99,186, a difference of 7.4%.
Householder Income Ages 25 - 44 years Correlation Summary
| Measurement | Immigrants from the Azores | Jordanian |
| Minimum | $48,897 | $47,305 |
| Maximum | $163,387 | $181,494 |
| Range | $114,490 | $134,189 |
| Mean | $97,325 | $99,931 |
| Median | $97,135 | $101,206 |
| Interquartile 25% (IQ1) | $74,519 | $80,556 |
| Interquartile 75% (IQ3) | $115,346 | $117,253 |
| Interquartile Range (IQR) | $40,827 | $36,697 |
| Standard Deviation (Sample) | $26,928 | $32,051 |
| Standard Deviation (Population) | $26,640 | $31,676 |
Similar Demographics by Householder Income Ages 25 - 44 years
Demographics Similar to Immigrants from the Azores by Householder Income Ages 25 - 44 years
In terms of householder income ages 25 - 44 years, the demographic groups most similar to Immigrants from the Azores are Samoan ($92,385, a difference of 0.070%), Celtic ($92,241, a difference of 0.090%), Immigrants from Colombia ($92,204, a difference of 0.13%), Spanish ($92,200, a difference of 0.13%), and Vietnamese ($92,089, a difference of 0.25%).
| Demographics | Rating | Rank | Householder Income Ages 25 - 44 years |
| Spaniards | 34.0 /100 | #187 | Fair $93,366 |
| Immigrants | Sierra Leone | 30.9 /100 | #188 | Fair $93,115 |
| Dutch | 30.5 /100 | #189 | Fair $93,081 |
| Welsh | 30.0 /100 | #190 | Fair $93,039 |
| Tlingit-Haida | 29.4 /100 | #191 | Fair $92,987 |
| Immigrants | Costa Rica | 28.2 /100 | #192 | Fair $92,876 |
| Samoans | 23.0 /100 | #193 | Fair $92,385 |
| Immigrants | Azores | 22.4 /100 | #194 | Fair $92,322 |
| Celtics | 21.6 /100 | #195 | Fair $92,241 |
| Immigrants | Colombia | 21.3 /100 | #196 | Fair $92,204 |
| Spanish | 21.2 /100 | #197 | Fair $92,200 |
| Vietnamese | 20.2 /100 | #198 | Fair $92,089 |
| Kenyans | 16.8 /100 | #199 | Poor $91,684 |
| Whites/Caucasians | 16.7 /100 | #200 | Poor $91,668 |
| Japanese | 16.4 /100 | #201 | Poor $91,624 |
Demographics Similar to Jordanians by Householder Income Ages 25 - 44 years
In terms of householder income ages 25 - 44 years, the demographic groups most similar to Jordanians are Syrian ($99,215, a difference of 0.030%), Immigrants from Northern Africa ($99,232, a difference of 0.050%), Swedish ($99,136, a difference of 0.050%), Portuguese ($99,429, a difference of 0.24%), and Carpatho Rusyn ($99,449, a difference of 0.27%).
| Demographics | Rating | Rank | Householder Income Ages 25 - 44 years |
| Poles | 94.5 /100 | #112 | Exceptional $99,685 |
| Tongans | 94.2 /100 | #113 | Exceptional $99,604 |
| Immigrants | Western Asia | 94.0 /100 | #114 | Exceptional $99,516 |
| Carpatho Rusyns | 93.7 /100 | #115 | Exceptional $99,449 |
| Portuguese | 93.7 /100 | #116 | Exceptional $99,429 |
| Immigrants | Northern Africa | 93.0 /100 | #117 | Exceptional $99,232 |
| Syrians | 92.9 /100 | #118 | Exceptional $99,215 |
| Jordanians | 92.8 /100 | #119 | Exceptional $99,186 |
| Swedes | 92.7 /100 | #120 | Exceptional $99,136 |
| Peruvians | 91.7 /100 | #121 | Exceptional $98,886 |
| Immigrants | Uzbekistan | 91.5 /100 | #122 | Exceptional $98,849 |
| Palestinians | 91.2 /100 | #123 | Exceptional $98,777 |
| Zimbabweans | 90.3 /100 | #124 | Exceptional $98,586 |
| Pakistanis | 89.3 /100 | #125 | Excellent $98,401 |
| British | 89.1 /100 | #126 | Excellent $98,359 |