Immigrants from Peru vs Immigrants from St. Vincent and the Grenadines Child Poverty Under the Age of 5
COMPARE
Immigrants from Peru
Immigrants from St. Vincent and the Grenadines
Child Poverty Under the Age of 5
Child Poverty Under the Age of 5 Comparison
Immigrants from Peru
Immigrants from St. Vincent and the Grenadines
16.1%
CHILD POVERTY UNDER THE AGE OF 5
92.6/ 100
METRIC RATING
120th/ 347
METRIC RANK
20.0%
CHILD POVERTY UNDER THE AGE OF 5
0.2/ 100
METRIC RATING
258th/ 347
METRIC RANK
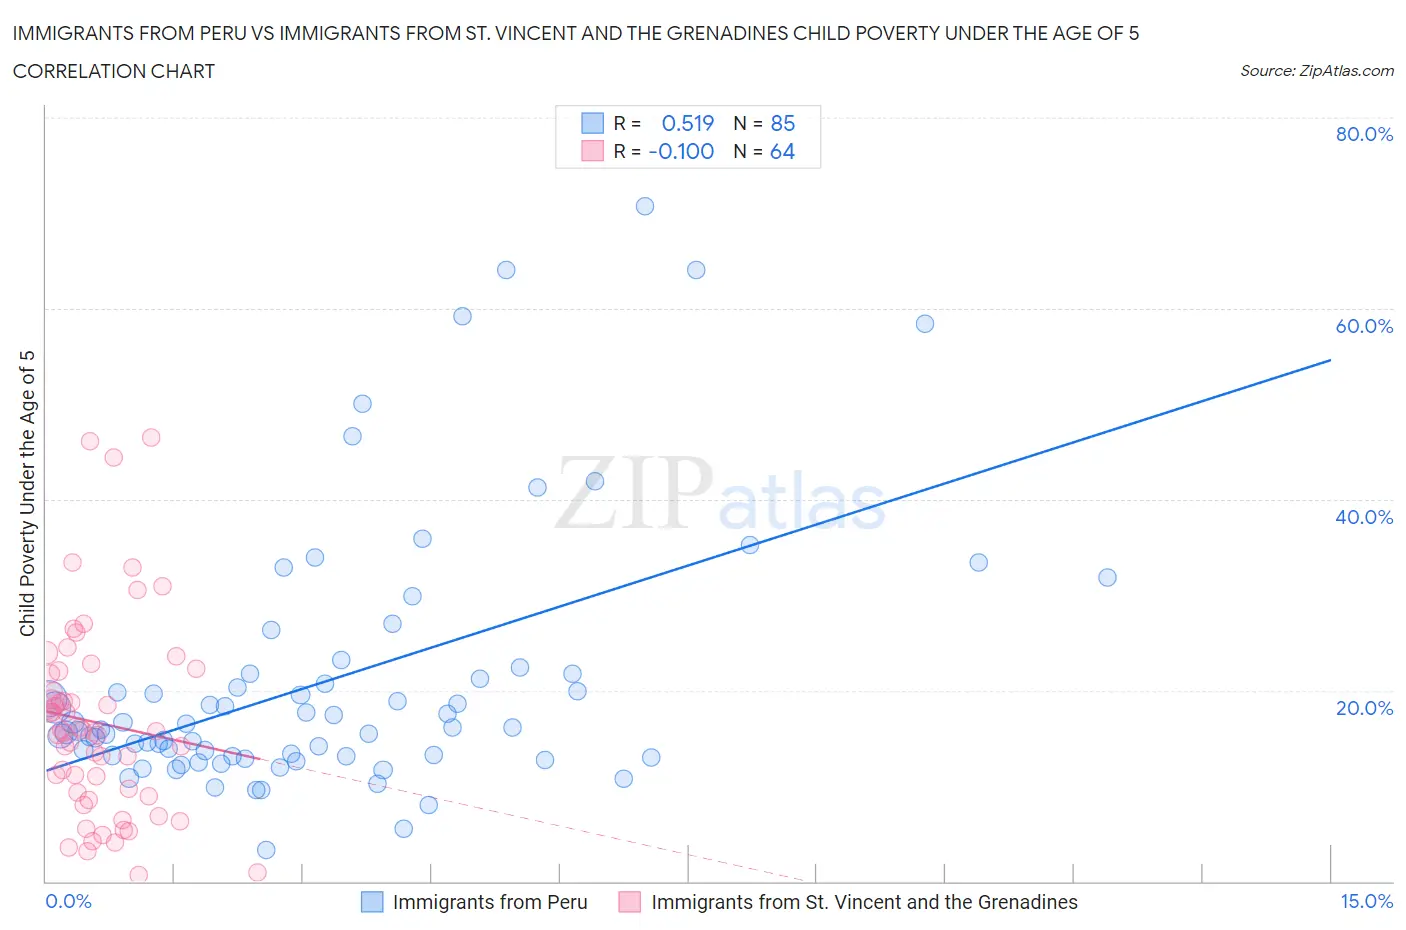
Immigrants from Peru vs Immigrants from St. Vincent and the Grenadines Child Poverty Under the Age of 5 Correlation Chart
The statistical analysis conducted on geographies consisting of 318,381,323 people shows a substantial positive correlation between the proportion of Immigrants from Peru and poverty level among children under the age of 5 in the United States with a correlation coefficient (R) of 0.519 and weighted average of 16.1%. Similarly, the statistical analysis conducted on geographies consisting of 55,885,863 people shows a slight negative correlation between the proportion of Immigrants from St. Vincent and the Grenadines and poverty level among children under the age of 5 in the United States with a correlation coefficient (R) of -0.100 and weighted average of 20.0%, a difference of 24.2%.
Child Poverty Under the Age of 5 Correlation Summary
| Measurement | Immigrants from Peru | Immigrants from St. Vincent and the Grenadines |
| Minimum | 3.3% | 0.65% |
| Maximum | 70.7% | 46.4% |
| Range | 67.3% | 45.8% |
| Mean | 21.0% | 16.6% |
| Median | 16.1% | 15.7% |
| Interquartile 25% (IQ1) | 13.1% | 9.1% |
| Interquartile 75% (IQ3) | 21.7% | 21.9% |
| Interquartile Range (IQR) | 8.6% | 12.8% |
| Standard Deviation (Sample) | 13.8% | 10.2% |
| Standard Deviation (Population) | 13.7% | 10.1% |
Similar Demographics by Child Poverty Under the Age of 5
Demographics Similar to Immigrants from Peru by Child Poverty Under the Age of 5
In terms of child poverty under the age of 5, the demographic groups most similar to Immigrants from Peru are Mongolian (16.1%, a difference of 0.010%), Immigrants from Southern Europe (16.1%, a difference of 0.20%), Austrian (16.1%, a difference of 0.23%), Swiss (16.1%, a difference of 0.24%), and Immigrants from Jordan (16.1%, a difference of 0.26%).
| Demographics | Rating | Rank | Child Poverty Under the Age of 5 |
| Puget Sound Salish | 94.1 /100 | #113 | Exceptional 16.0% |
| Immigrants | Kuwait | 93.9 /100 | #114 | Exceptional 16.0% |
| Albanians | 93.8 /100 | #115 | Exceptional 16.0% |
| Immigrants | Austria | 93.5 /100 | #116 | Exceptional 16.0% |
| Basques | 93.4 /100 | #117 | Exceptional 16.0% |
| Immigrants | Denmark | 93.4 /100 | #118 | Exceptional 16.0% |
| Immigrants | Jordan | 93.2 /100 | #119 | Exceptional 16.1% |
| Immigrants | Peru | 92.6 /100 | #120 | Exceptional 16.1% |
| Mongolians | 92.5 /100 | #121 | Exceptional 16.1% |
| Immigrants | Southern Europe | 92.0 /100 | #122 | Exceptional 16.1% |
| Austrians | 92.0 /100 | #123 | Exceptional 16.1% |
| Swiss | 92.0 /100 | #124 | Exceptional 16.1% |
| Native Hawaiians | 91.8 /100 | #125 | Exceptional 16.2% |
| Immigrants | Albania | 91.8 /100 | #126 | Exceptional 16.2% |
| Immigrants | England | 91.5 /100 | #127 | Exceptional 16.2% |
Demographics Similar to Immigrants from St. Vincent and the Grenadines by Child Poverty Under the Age of 5
In terms of child poverty under the age of 5, the demographic groups most similar to Immigrants from St. Vincent and the Grenadines are Immigrants from El Salvador (20.0%, a difference of 0.030%), Shoshone (20.0%, a difference of 0.14%), Immigrants from Barbados (20.0%, a difference of 0.15%), Immigrants from Cuba (19.9%, a difference of 0.37%), and Spanish American (20.1%, a difference of 0.43%).
| Demographics | Rating | Rank | Child Poverty Under the Age of 5 |
| Pennsylvania Germans | 0.3 /100 | #251 | Tragic 19.8% |
| Immigrants | Nicaragua | 0.3 /100 | #252 | Tragic 19.8% |
| Mexican American Indians | 0.3 /100 | #253 | Tragic 19.9% |
| Fijians | 0.3 /100 | #254 | Tragic 19.9% |
| Immigrants | Cuba | 0.2 /100 | #255 | Tragic 19.9% |
| Immigrants | Barbados | 0.2 /100 | #256 | Tragic 20.0% |
| Shoshone | 0.2 /100 | #257 | Tragic 20.0% |
| Immigrants | St. Vincent and the Grenadines | 0.2 /100 | #258 | Tragic 20.0% |
| Immigrants | El Salvador | 0.2 /100 | #259 | Tragic 20.0% |
| Spanish Americans | 0.2 /100 | #260 | Tragic 20.1% |
| Immigrants | Bangladesh | 0.2 /100 | #261 | Tragic 20.1% |
| Liberians | 0.1 /100 | #262 | Tragic 20.2% |
| Barbadians | 0.1 /100 | #263 | Tragic 20.2% |
| Immigrants | Liberia | 0.1 /100 | #264 | Tragic 20.2% |
| Spanish American Indians | 0.1 /100 | #265 | Tragic 20.2% |