Italian vs Immigrants from St. Vincent and the Grenadines Child Poverty Under the Age of 5
COMPARE
Italian
Immigrants from St. Vincent and the Grenadines
Child Poverty Under the Age of 5
Child Poverty Under the Age of 5 Comparison
Italians
Immigrants from St. Vincent and the Grenadines
15.5%
CHILD POVERTY UNDER THE AGE OF 5
97.9/ 100
METRIC RATING
80th/ 347
METRIC RANK
20.0%
CHILD POVERTY UNDER THE AGE OF 5
0.2/ 100
METRIC RATING
258th/ 347
METRIC RANK
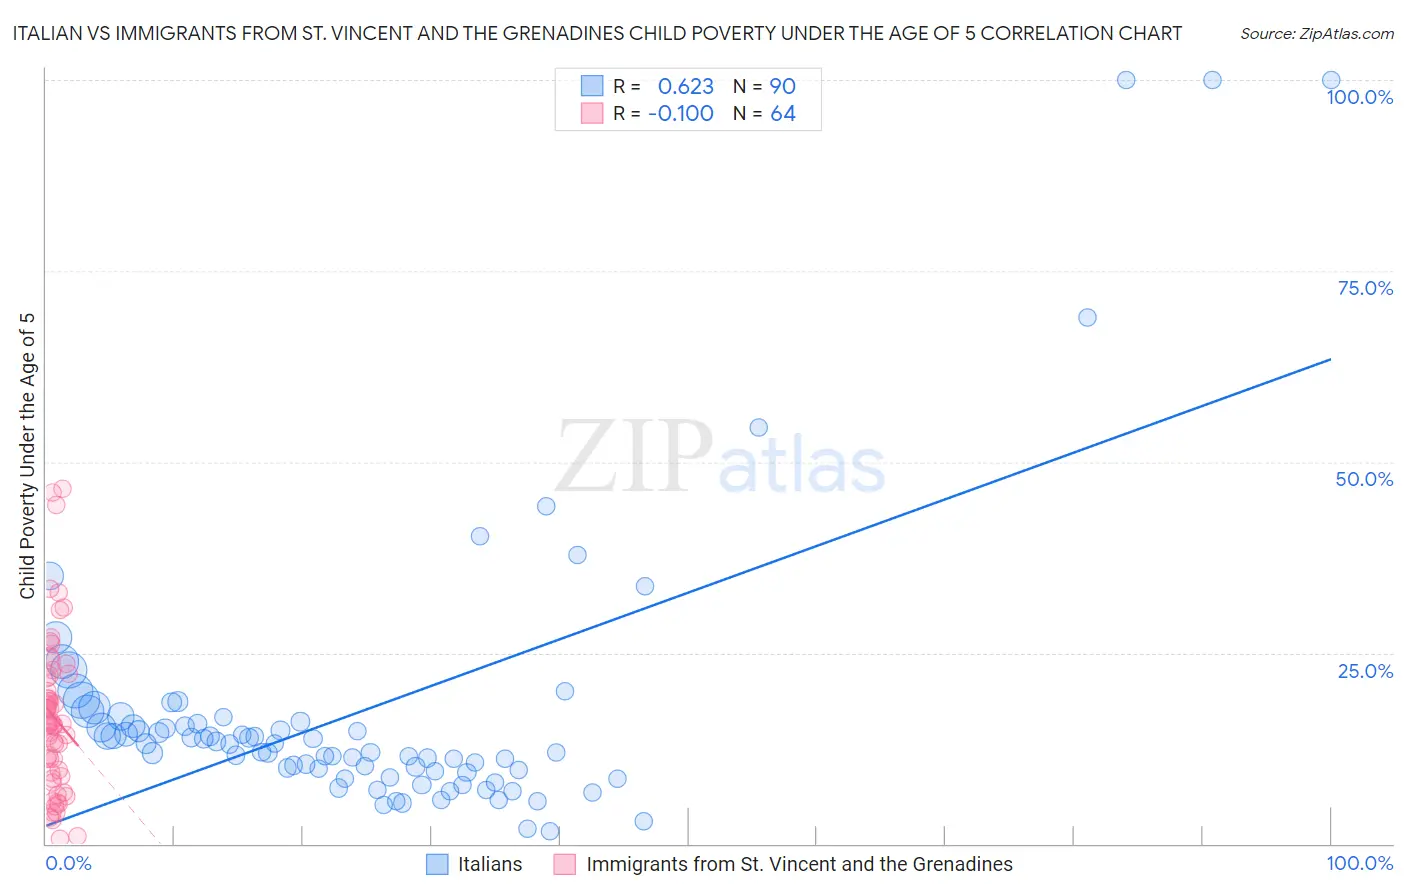
Italian vs Immigrants from St. Vincent and the Grenadines Child Poverty Under the Age of 5 Correlation Chart
The statistical analysis conducted on geographies consisting of 533,440,321 people shows a significant positive correlation between the proportion of Italians and poverty level among children under the age of 5 in the United States with a correlation coefficient (R) of 0.623 and weighted average of 15.5%. Similarly, the statistical analysis conducted on geographies consisting of 55,885,863 people shows a slight negative correlation between the proportion of Immigrants from St. Vincent and the Grenadines and poverty level among children under the age of 5 in the United States with a correlation coefficient (R) of -0.100 and weighted average of 20.0%, a difference of 28.9%.
Child Poverty Under the Age of 5 Correlation Summary
| Measurement | Italian | Immigrants from St. Vincent and the Grenadines |
| Minimum | 1.6% | 0.65% |
| Maximum | 100.0% | 46.4% |
| Range | 98.4% | 45.8% |
| Mean | 17.5% | 16.6% |
| Median | 13.0% | 15.7% |
| Interquartile 25% (IQ1) | 9.6% | 9.1% |
| Interquartile 75% (IQ3) | 16.0% | 21.9% |
| Interquartile Range (IQR) | 6.4% | 12.8% |
| Standard Deviation (Sample) | 18.6% | 10.2% |
| Standard Deviation (Population) | 18.5% | 10.1% |
Similar Demographics by Child Poverty Under the Age of 5
Demographics Similar to Italians by Child Poverty Under the Age of 5
In terms of child poverty under the age of 5, the demographic groups most similar to Italians are Australian (15.5%, a difference of 0.11%), Czech (15.5%, a difference of 0.11%), Immigrants from Italy (15.6%, a difference of 0.25%), Sri Lankan (15.5%, a difference of 0.37%), and Chilean (15.6%, a difference of 0.41%).
| Demographics | Rating | Rank | Child Poverty Under the Age of 5 |
| Immigrants | Ukraine | 98.7 /100 | #73 | Exceptional 15.3% |
| Argentineans | 98.5 /100 | #74 | Exceptional 15.4% |
| Immigrants | Argentina | 98.5 /100 | #75 | Exceptional 15.4% |
| Croatians | 98.5 /100 | #76 | Exceptional 15.4% |
| Immigrants | Turkey | 98.3 /100 | #77 | Exceptional 15.4% |
| Sri Lankans | 98.1 /100 | #78 | Exceptional 15.5% |
| Australians | 98.0 /100 | #79 | Exceptional 15.5% |
| Italians | 97.9 /100 | #80 | Exceptional 15.5% |
| Czechs | 97.8 /100 | #81 | Exceptional 15.5% |
| Immigrants | Italy | 97.7 /100 | #82 | Exceptional 15.6% |
| Chileans | 97.6 /100 | #83 | Exceptional 15.6% |
| Immigrants | Netherlands | 97.6 /100 | #84 | Exceptional 15.6% |
| Immigrants | Latvia | 97.4 /100 | #85 | Exceptional 15.6% |
| Immigrants | Malaysia | 97.4 /100 | #86 | Exceptional 15.6% |
| Immigrants | Vietnam | 97.4 /100 | #87 | Exceptional 15.6% |
Demographics Similar to Immigrants from St. Vincent and the Grenadines by Child Poverty Under the Age of 5
In terms of child poverty under the age of 5, the demographic groups most similar to Immigrants from St. Vincent and the Grenadines are Immigrants from El Salvador (20.0%, a difference of 0.030%), Shoshone (20.0%, a difference of 0.14%), Immigrants from Barbados (20.0%, a difference of 0.15%), Immigrants from Cuba (19.9%, a difference of 0.37%), and Spanish American (20.1%, a difference of 0.43%).
| Demographics | Rating | Rank | Child Poverty Under the Age of 5 |
| Pennsylvania Germans | 0.3 /100 | #251 | Tragic 19.8% |
| Immigrants | Nicaragua | 0.3 /100 | #252 | Tragic 19.8% |
| Mexican American Indians | 0.3 /100 | #253 | Tragic 19.9% |
| Fijians | 0.3 /100 | #254 | Tragic 19.9% |
| Immigrants | Cuba | 0.2 /100 | #255 | Tragic 19.9% |
| Immigrants | Barbados | 0.2 /100 | #256 | Tragic 20.0% |
| Shoshone | 0.2 /100 | #257 | Tragic 20.0% |
| Immigrants | St. Vincent and the Grenadines | 0.2 /100 | #258 | Tragic 20.0% |
| Immigrants | El Salvador | 0.2 /100 | #259 | Tragic 20.0% |
| Spanish Americans | 0.2 /100 | #260 | Tragic 20.1% |
| Immigrants | Bangladesh | 0.2 /100 | #261 | Tragic 20.1% |
| Liberians | 0.1 /100 | #262 | Tragic 20.2% |
| Barbadians | 0.1 /100 | #263 | Tragic 20.2% |
| Immigrants | Liberia | 0.1 /100 | #264 | Tragic 20.2% |
| Spanish American Indians | 0.1 /100 | #265 | Tragic 20.2% |