Immigrants from Armenia vs Kenyan Receiving Food Stamps
COMPARE
Immigrants from Armenia
Kenyan
Receiving Food Stamps
Receiving Food Stamps Comparison
Immigrants from Armenia
Kenyans
13.0%
RECEIVING FOOD STAMPS
4.3/ 100
METRIC RATING
224th/ 347
METRIC RANK
11.6%
RECEIVING FOOD STAMPS
60.2/ 100
METRIC RATING
167th/ 347
METRIC RANK
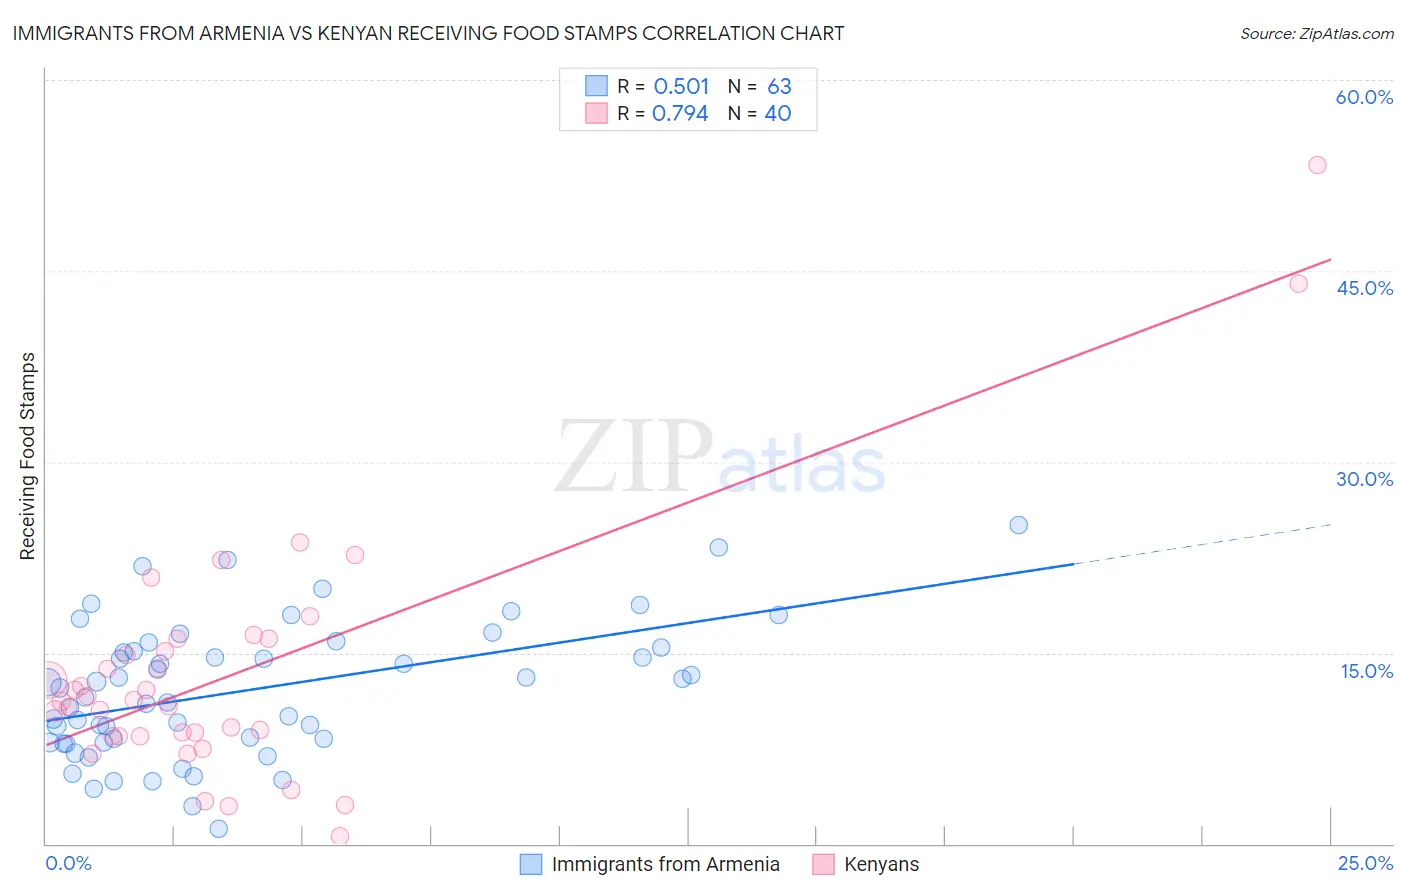
Immigrants from Armenia vs Kenyan Receiving Food Stamps Correlation Chart
The statistical analysis conducted on geographies consisting of 97,612,331 people shows a substantial positive correlation between the proportion of Immigrants from Armenia and percentage of population receiving government assistance and/or food stamps in the United States with a correlation coefficient (R) of 0.501 and weighted average of 13.0%. Similarly, the statistical analysis conducted on geographies consisting of 168,088,158 people shows a strong positive correlation between the proportion of Kenyans and percentage of population receiving government assistance and/or food stamps in the United States with a correlation coefficient (R) of 0.794 and weighted average of 11.6%, a difference of 12.5%.
Receiving Food Stamps Correlation Summary
| Measurement | Immigrants from Armenia | Kenyan |
| Minimum | 1.2% | 0.60% |
| Maximum | 25.0% | 53.3% |
| Range | 23.8% | 52.7% |
| Mean | 12.1% | 13.3% |
| Median | 12.2% | 11.2% |
| Interquartile 25% (IQ1) | 8.0% | 8.5% |
| Interquartile 75% (IQ3) | 15.4% | 15.6% |
| Interquartile Range (IQR) | 7.4% | 7.2% |
| Standard Deviation (Sample) | 5.3% | 9.9% |
| Standard Deviation (Population) | 5.2% | 9.7% |
Similar Demographics by Receiving Food Stamps
Demographics Similar to Immigrants from Armenia by Receiving Food Stamps
In terms of receiving food stamps, the demographic groups most similar to Immigrants from Armenia are Fijian (13.0%, a difference of 0.020%), Immigrants from Albania (13.0%, a difference of 0.070%), Immigrants (13.0%, a difference of 0.11%), Bermudan (13.0%, a difference of 0.37%), and Chickasaw (13.1%, a difference of 0.62%).
| Demographics | Rating | Rank | Receiving Food Stamps |
| Immigrants | Burma/Myanmar | 6.0 /100 | #217 | Tragic 12.9% |
| Hawaiians | 5.4 /100 | #218 | Tragic 12.9% |
| Immigrants | Middle Africa | 5.4 /100 | #219 | Tragic 12.9% |
| Immigrants | Colombia | 5.3 /100 | #220 | Tragic 12.9% |
| Bermudans | 4.8 /100 | #221 | Tragic 13.0% |
| Immigrants | Immigrants | 4.4 /100 | #222 | Tragic 13.0% |
| Immigrants | Albania | 4.4 /100 | #223 | Tragic 13.0% |
| Immigrants | Armenia | 4.3 /100 | #224 | Tragic 13.0% |
| Fijians | 4.3 /100 | #225 | Tragic 13.0% |
| Chickasaw | 3.6 /100 | #226 | Tragic 13.1% |
| Nigerians | 3.5 /100 | #227 | Tragic 13.1% |
| Panamanians | 3.5 /100 | #228 | Tragic 13.1% |
| Ottawa | 3.5 /100 | #229 | Tragic 13.1% |
| Puget Sound Salish | 3.4 /100 | #230 | Tragic 13.1% |
| Immigrants | Nigeria | 3.4 /100 | #231 | Tragic 13.1% |
Demographics Similar to Kenyans by Receiving Food Stamps
In terms of receiving food stamps, the demographic groups most similar to Kenyans are Tlingit-Haida (11.6%, a difference of 0.16%), Immigrants from Eastern Africa (11.6%, a difference of 0.28%), Costa Rican (11.6%, a difference of 0.35%), Immigrants from Belarus (11.5%, a difference of 0.38%), and Immigrants from Western Asia (11.6%, a difference of 0.56%).
| Demographics | Rating | Rank | Receiving Food Stamps |
| French Canadians | 69.5 /100 | #160 | Good 11.4% |
| Pennsylvania Germans | 68.4 /100 | #161 | Good 11.4% |
| Alsatians | 68.0 /100 | #162 | Good 11.4% |
| Immigrants | Southern Europe | 65.8 /100 | #163 | Good 11.5% |
| Immigrants | Chile | 65.0 /100 | #164 | Good 11.5% |
| Arabs | 64.7 /100 | #165 | Good 11.5% |
| Immigrants | Belarus | 62.8 /100 | #166 | Good 11.5% |
| Kenyans | 60.2 /100 | #167 | Good 11.6% |
| Tlingit-Haida | 59.1 /100 | #168 | Average 11.6% |
| Immigrants | Eastern Africa | 58.3 /100 | #169 | Average 11.6% |
| Costa Ricans | 57.9 /100 | #170 | Average 11.6% |
| Immigrants | Western Asia | 56.4 /100 | #171 | Average 11.6% |
| Guamanians/Chamorros | 54.2 /100 | #172 | Average 11.7% |
| Immigrants | Syria | 53.4 /100 | #173 | Average 11.7% |
| Immigrants | Eritrea | 50.0 /100 | #174 | Average 11.7% |