Immigrants from Armenia vs Kenyan Unemployment Among Seniors over 75 years
COMPARE
Immigrants from Armenia
Kenyan
Unemployment Among Seniors over 75 years
Unemployment Among Seniors over 75 years Comparison
Immigrants from Armenia
Kenyans
6.5%
UNEMPLOYMENT AMONG SENIORS OVER 75 YEARS
100.0/ 100
METRIC RATING
6th/ 347
METRIC RANK
9.1%
UNEMPLOYMENT AMONG SENIORS OVER 75 YEARS
5.4/ 100
METRIC RATING
228th/ 347
METRIC RANK
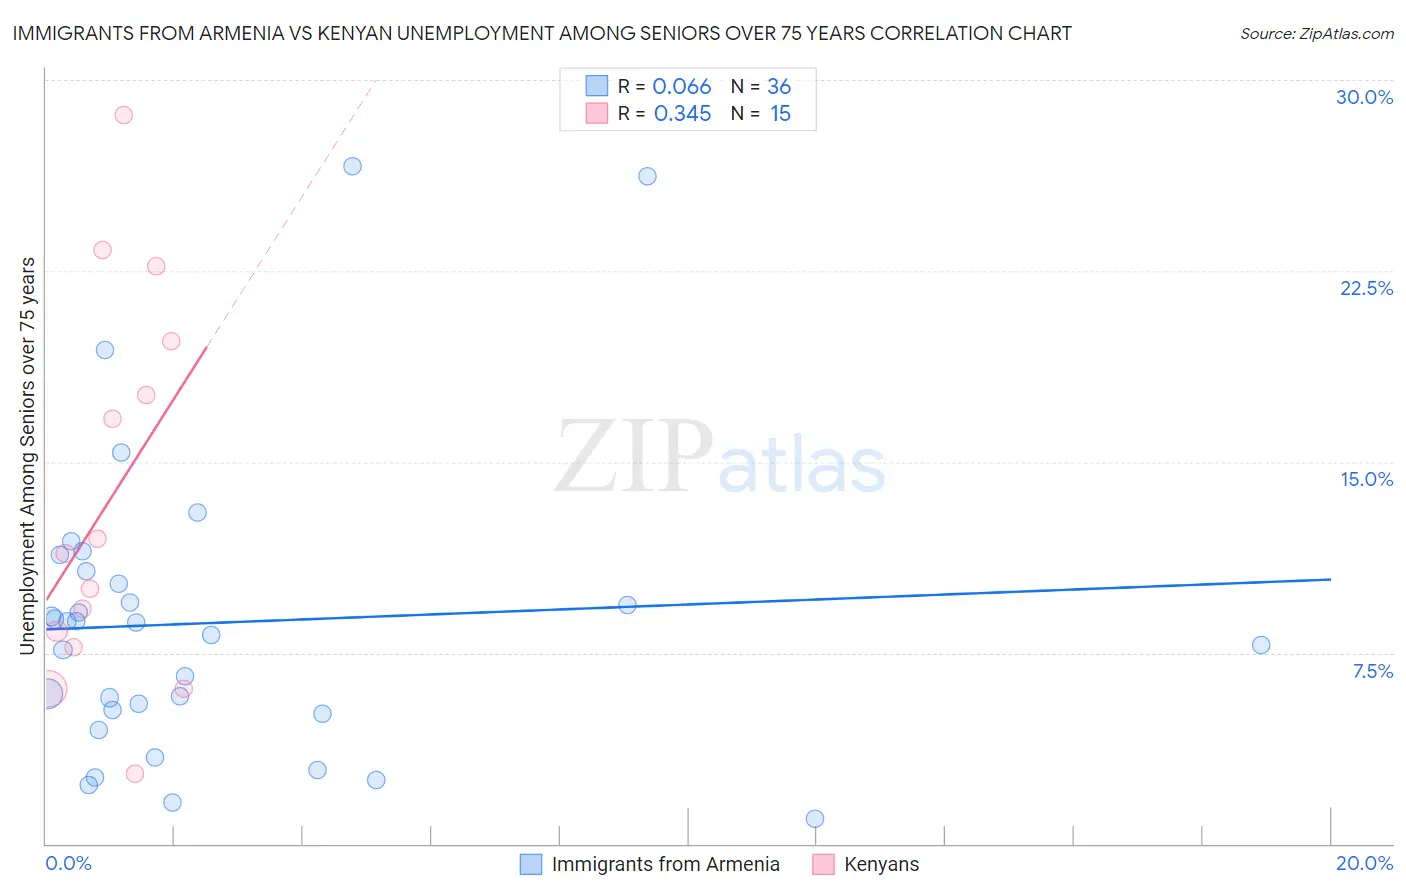
Immigrants from Armenia vs Kenyan Unemployment Among Seniors over 75 years Correlation Chart
The statistical analysis conducted on geographies consisting of 75,716,267 people shows a slight positive correlation between the proportion of Immigrants from Armenia and unemployment rate among seniors over the age of 75 in the United States with a correlation coefficient (R) of 0.066 and weighted average of 6.5%. Similarly, the statistical analysis conducted on geographies consisting of 111,094,632 people shows a mild positive correlation between the proportion of Kenyans and unemployment rate among seniors over the age of 75 in the United States with a correlation coefficient (R) of 0.345 and weighted average of 9.1%, a difference of 39.4%.
Unemployment Among Seniors over 75 years Correlation Summary
| Measurement | Immigrants from Armenia | Kenyan |
| Minimum | 1.0% | 2.8% |
| Maximum | 26.6% | 28.6% |
| Range | 25.6% | 25.8% |
| Mean | 8.7% | 13.5% |
| Median | 8.4% | 11.4% |
| Interquartile 25% (IQ1) | 5.2% | 7.7% |
| Interquartile 75% (IQ3) | 10.5% | 19.7% |
| Interquartile Range (IQR) | 5.3% | 12.0% |
| Standard Deviation (Sample) | 5.9% | 7.5% |
| Standard Deviation (Population) | 5.8% | 7.3% |
Similar Demographics by Unemployment Among Seniors over 75 years
Demographics Similar to Immigrants from Armenia by Unemployment Among Seniors over 75 years
In terms of unemployment among seniors over 75 years, the demographic groups most similar to Immigrants from Armenia are Spanish American Indian (6.5%, a difference of 0.39%), Taiwanese (6.6%, a difference of 0.79%), Soviet Union (6.6%, a difference of 2.1%), Yuman (6.7%, a difference of 2.3%), and Immigrants from Grenada (6.7%, a difference of 2.4%).
| Demographics | Rating | Rank | Unemployment Among Seniors over 75 years |
| Crow | 100.0 /100 | #1 | Exceptional 5.9% |
| Chinese | 100.0 /100 | #2 | Exceptional 5.9% |
| Cheyenne | 100.0 /100 | #3 | Exceptional 5.9% |
| Alsatians | 100.0 /100 | #4 | Exceptional 6.1% |
| Hopi | 100.0 /100 | #5 | Exceptional 6.3% |
| Immigrants | Armenia | 100.0 /100 | #6 | Exceptional 6.5% |
| Spanish American Indians | 100.0 /100 | #7 | Exceptional 6.5% |
| Taiwanese | 100.0 /100 | #8 | Exceptional 6.6% |
| Soviet Union | 100.0 /100 | #9 | Exceptional 6.6% |
| Yuman | 100.0 /100 | #10 | Exceptional 6.7% |
| Immigrants | Grenada | 100.0 /100 | #11 | Exceptional 6.7% |
| Comanche | 100.0 /100 | #12 | Exceptional 6.7% |
| Immigrants | Congo | 100.0 /100 | #13 | Exceptional 6.7% |
| Ute | 100.0 /100 | #14 | Exceptional 6.8% |
| Icelanders | 100.0 /100 | #15 | Exceptional 7.0% |
Demographics Similar to Kenyans by Unemployment Among Seniors over 75 years
In terms of unemployment among seniors over 75 years, the demographic groups most similar to Kenyans are Samoan (9.1%, a difference of 0.060%), Immigrants from Bangladesh (9.1%, a difference of 0.11%), Hispanic or Latino (9.1%, a difference of 0.12%), Northern European (9.1%, a difference of 0.13%), and Immigrants from Central America (9.1%, a difference of 0.13%).
| Demographics | Rating | Rank | Unemployment Among Seniors over 75 years |
| Guamanians/Chamorros | 7.7 /100 | #221 | Tragic 9.0% |
| Peruvians | 7.3 /100 | #222 | Tragic 9.0% |
| Immigrants | Jordan | 6.9 /100 | #223 | Tragic 9.0% |
| Costa Ricans | 6.3 /100 | #224 | Tragic 9.1% |
| Navajo | 6.1 /100 | #225 | Tragic 9.1% |
| Immigrants | Bangladesh | 5.9 /100 | #226 | Tragic 9.1% |
| Samoans | 5.7 /100 | #227 | Tragic 9.1% |
| Kenyans | 5.4 /100 | #228 | Tragic 9.1% |
| Hispanics or Latinos | 5.0 /100 | #229 | Tragic 9.1% |
| Northern Europeans | 4.9 /100 | #230 | Tragic 9.1% |
| Immigrants | Central America | 4.9 /100 | #231 | Tragic 9.1% |
| Africans | 4.9 /100 | #232 | Tragic 9.1% |
| Yugoslavians | 4.8 /100 | #233 | Tragic 9.1% |
| Vietnamese | 4.6 /100 | #234 | Tragic 9.1% |
| Panamanians | 4.0 /100 | #235 | Tragic 9.1% |