Immigrants from Armenia vs Israeli Receiving Food Stamps
COMPARE
Immigrants from Armenia
Israeli
Receiving Food Stamps
Receiving Food Stamps Comparison
Immigrants from Armenia
Israelis
13.0%
RECEIVING FOOD STAMPS
4.3/ 100
METRIC RATING
224th/ 347
METRIC RANK
10.7%
RECEIVING FOOD STAMPS
92.4/ 100
METRIC RATING
130th/ 347
METRIC RANK
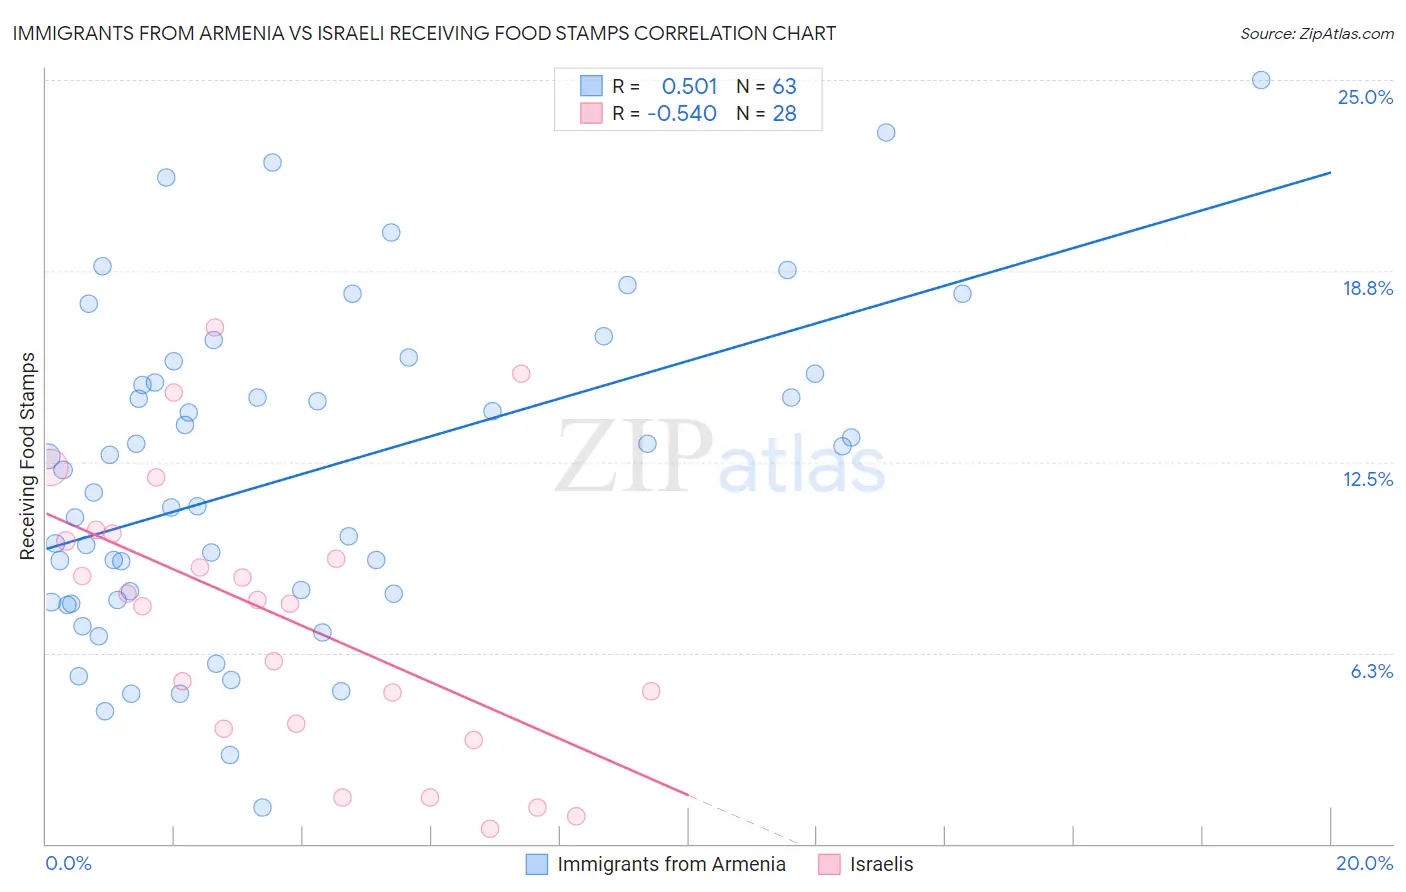
Immigrants from Armenia vs Israeli Receiving Food Stamps Correlation Chart
The statistical analysis conducted on geographies consisting of 97,612,331 people shows a substantial positive correlation between the proportion of Immigrants from Armenia and percentage of population receiving government assistance and/or food stamps in the United States with a correlation coefficient (R) of 0.501 and weighted average of 13.0%. Similarly, the statistical analysis conducted on geographies consisting of 210,490,548 people shows a substantial negative correlation between the proportion of Israelis and percentage of population receiving government assistance and/or food stamps in the United States with a correlation coefficient (R) of -0.540 and weighted average of 10.7%, a difference of 21.4%.
Receiving Food Stamps Correlation Summary
| Measurement | Immigrants from Armenia | Israeli |
| Minimum | 1.2% | 0.50% |
| Maximum | 25.0% | 16.9% |
| Range | 23.8% | 16.4% |
| Mean | 12.1% | 7.4% |
| Median | 12.2% | 7.9% |
| Interquartile 25% (IQ1) | 8.0% | 3.9% |
| Interquartile 75% (IQ3) | 15.4% | 10.0% |
| Interquartile Range (IQR) | 7.4% | 6.2% |
| Standard Deviation (Sample) | 5.3% | 4.5% |
| Standard Deviation (Population) | 5.2% | 4.4% |
Similar Demographics by Receiving Food Stamps
Demographics Similar to Immigrants from Armenia by Receiving Food Stamps
In terms of receiving food stamps, the demographic groups most similar to Immigrants from Armenia are Fijian (13.0%, a difference of 0.020%), Immigrants from Albania (13.0%, a difference of 0.070%), Immigrants (13.0%, a difference of 0.11%), Bermudan (13.0%, a difference of 0.37%), and Chickasaw (13.1%, a difference of 0.62%).
| Demographics | Rating | Rank | Receiving Food Stamps |
| Immigrants | Burma/Myanmar | 6.0 /100 | #217 | Tragic 12.9% |
| Hawaiians | 5.4 /100 | #218 | Tragic 12.9% |
| Immigrants | Middle Africa | 5.4 /100 | #219 | Tragic 12.9% |
| Immigrants | Colombia | 5.3 /100 | #220 | Tragic 12.9% |
| Bermudans | 4.8 /100 | #221 | Tragic 13.0% |
| Immigrants | Immigrants | 4.4 /100 | #222 | Tragic 13.0% |
| Immigrants | Albania | 4.4 /100 | #223 | Tragic 13.0% |
| Immigrants | Armenia | 4.3 /100 | #224 | Tragic 13.0% |
| Fijians | 4.3 /100 | #225 | Tragic 13.0% |
| Chickasaw | 3.6 /100 | #226 | Tragic 13.1% |
| Nigerians | 3.5 /100 | #227 | Tragic 13.1% |
| Panamanians | 3.5 /100 | #228 | Tragic 13.1% |
| Ottawa | 3.5 /100 | #229 | Tragic 13.1% |
| Puget Sound Salish | 3.4 /100 | #230 | Tragic 13.1% |
| Immigrants | Nigeria | 3.4 /100 | #231 | Tragic 13.1% |
Demographics Similar to Israelis by Receiving Food Stamps
In terms of receiving food stamps, the demographic groups most similar to Israelis are French (10.7%, a difference of 0.0%), Immigrants from Jordan (10.7%, a difference of 0.10%), Yugoslavian (10.7%, a difference of 0.10%), Immigrants from Ethiopia (10.7%, a difference of 0.11%), and Afghan (10.7%, a difference of 0.13%).
| Demographics | Rating | Rank | Receiving Food Stamps |
| Immigrants | Philippines | 93.3 /100 | #123 | Exceptional 10.7% |
| Paraguayans | 93.0 /100 | #124 | Exceptional 10.7% |
| Ukrainians | 92.8 /100 | #125 | Exceptional 10.7% |
| Afghans | 92.6 /100 | #126 | Exceptional 10.7% |
| Immigrants | Ethiopia | 92.6 /100 | #127 | Exceptional 10.7% |
| Immigrants | Jordan | 92.5 /100 | #128 | Exceptional 10.7% |
| Yugoslavians | 92.5 /100 | #129 | Exceptional 10.7% |
| Israelis | 92.4 /100 | #130 | Exceptional 10.7% |
| French | 92.3 /100 | #131 | Exceptional 10.7% |
| Immigrants | Germany | 92.0 /100 | #132 | Exceptional 10.7% |
| Immigrants | Russia | 90.9 /100 | #133 | Exceptional 10.8% |
| Immigrants | Brazil | 90.3 /100 | #134 | Exceptional 10.8% |
| Argentineans | 90.2 /100 | #135 | Exceptional 10.8% |
| Slovaks | 89.8 /100 | #136 | Excellent 10.8% |
| Immigrants | Eastern Europe | 89.8 /100 | #137 | Excellent 10.8% |