Immigrants from Armenia vs Kenyan Unemployment Among Ages 45 to 54 years
COMPARE
Immigrants from Armenia
Kenyan
Unemployment Among Ages 45 to 54 years
Unemployment Among Ages 45 to 54 years Comparison
Immigrants from Armenia
Kenyans
6.1%
UNEMPLOYMENT AMONG AGES 45 TO 54 YEARS
0.0/ 100
METRIC RATING
325th/ 347
METRIC RANK
4.3%
UNEMPLOYMENT AMONG AGES 45 TO 54 YEARS
98.1/ 100
METRIC RATING
75th/ 347
METRIC RANK
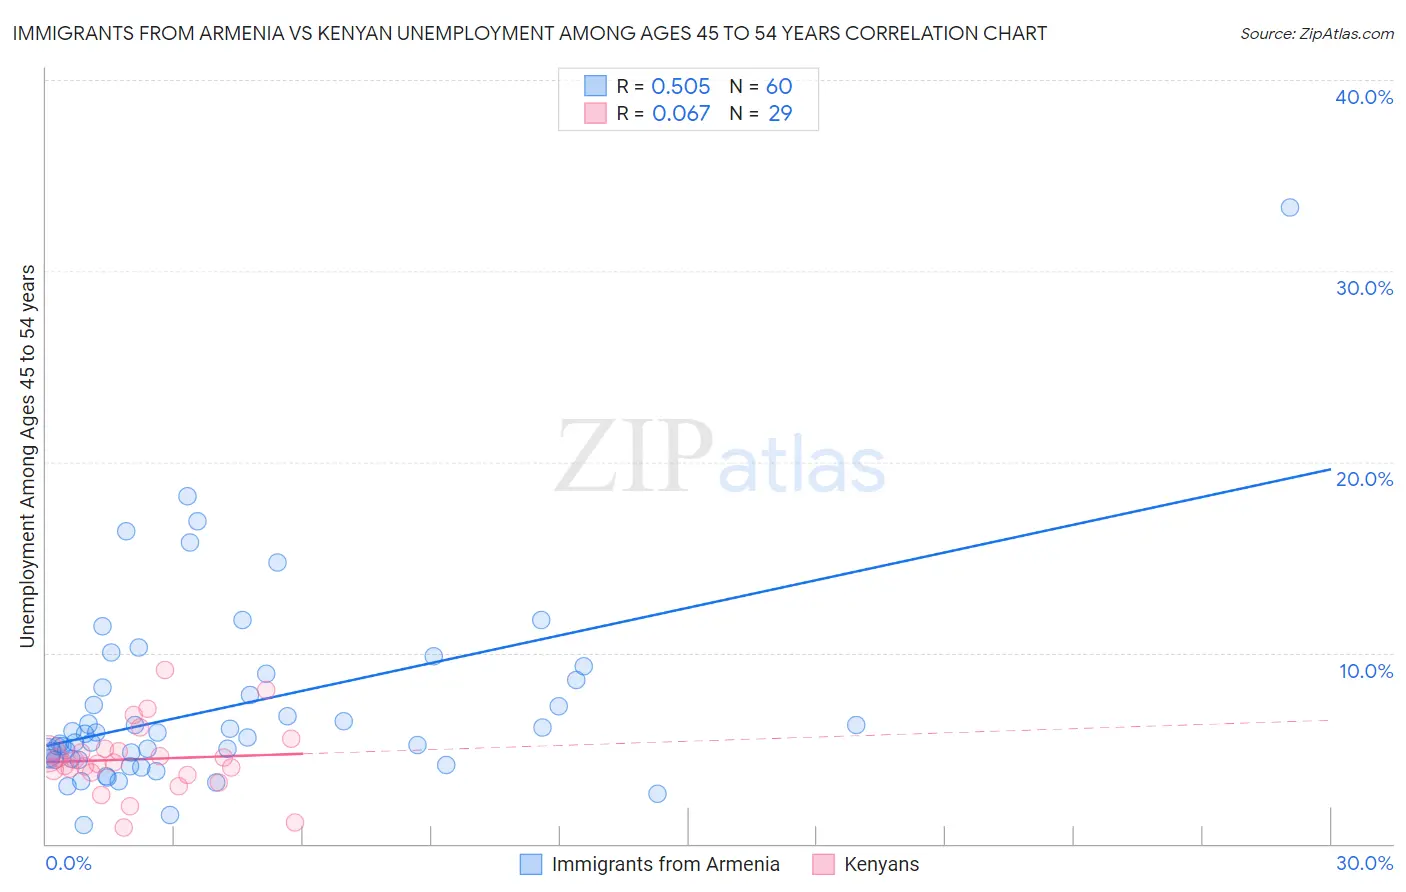
Immigrants from Armenia vs Kenyan Unemployment Among Ages 45 to 54 years Correlation Chart
The statistical analysis conducted on geographies consisting of 97,342,787 people shows a substantial positive correlation between the proportion of Immigrants from Armenia and unemployment rate among population between the ages 45 and 54 in the United States with a correlation coefficient (R) of 0.505 and weighted average of 6.1%. Similarly, the statistical analysis conducted on geographies consisting of 166,610,701 people shows a slight positive correlation between the proportion of Kenyans and unemployment rate among population between the ages 45 and 54 in the United States with a correlation coefficient (R) of 0.067 and weighted average of 4.3%, a difference of 42.3%.
Unemployment Among Ages 45 to 54 years Correlation Summary
| Measurement | Immigrants from Armenia | Kenyan |
| Minimum | 1.0% | 0.86% |
| Maximum | 33.3% | 9.1% |
| Range | 32.3% | 8.3% |
| Mean | 7.2% | 4.4% |
| Median | 5.6% | 4.2% |
| Interquartile 25% (IQ1) | 4.4% | 3.7% |
| Interquartile 75% (IQ3) | 8.4% | 4.9% |
| Interquartile Range (IQR) | 4.0% | 1.3% |
| Standard Deviation (Sample) | 5.1% | 1.8% |
| Standard Deviation (Population) | 5.1% | 1.8% |
Similar Demographics by Unemployment Among Ages 45 to 54 years
Demographics Similar to Immigrants from Armenia by Unemployment Among Ages 45 to 54 years
In terms of unemployment among ages 45 to 54 years, the demographic groups most similar to Immigrants from Armenia are Ute (6.2%, a difference of 0.84%), Dominican (6.2%, a difference of 1.1%), Pueblo (6.2%, a difference of 1.3%), Native/Alaskan (6.1%, a difference of 1.3%), and Alaska Native (6.3%, a difference of 2.0%).
| Demographics | Rating | Rank | Unemployment Among Ages 45 to 54 years |
| British West Indians | 0.0 /100 | #318 | Tragic 5.7% |
| Cape Verdeans | 0.0 /100 | #319 | Tragic 5.7% |
| Immigrants | St. Vincent and the Grenadines | 0.0 /100 | #320 | Tragic 5.7% |
| Yakama | 0.0 /100 | #321 | Tragic 5.7% |
| Immigrants | Azores | 0.0 /100 | #322 | Tragic 5.7% |
| Immigrants | Cabo Verde | 0.0 /100 | #323 | Tragic 5.9% |
| Natives/Alaskans | 0.0 /100 | #324 | Tragic 6.1% |
| Immigrants | Armenia | 0.0 /100 | #325 | Tragic 6.1% |
| Ute | 0.0 /100 | #326 | Tragic 6.2% |
| Dominicans | 0.0 /100 | #327 | Tragic 6.2% |
| Pueblo | 0.0 /100 | #328 | Tragic 6.2% |
| Alaska Natives | 0.0 /100 | #329 | Tragic 6.3% |
| Immigrants | Dominican Republic | 0.0 /100 | #330 | Tragic 6.3% |
| Tohono O'odham | 0.0 /100 | #331 | Tragic 6.3% |
| Pima | 0.0 /100 | #332 | Tragic 6.4% |
Demographics Similar to Kenyans by Unemployment Among Ages 45 to 54 years
In terms of unemployment among ages 45 to 54 years, the demographic groups most similar to Kenyans are Slavic (4.3%, a difference of 0.010%), Immigrants from Belgium (4.3%, a difference of 0.030%), Canadian (4.3%, a difference of 0.040%), Chilean (4.3%, a difference of 0.060%), and German Russian (4.3%, a difference of 0.15%).
| Demographics | Rating | Rank | Unemployment Among Ages 45 to 54 years |
| Slovaks | 98.8 /100 | #68 | Exceptional 4.3% |
| Immigrants | Japan | 98.7 /100 | #69 | Exceptional 4.3% |
| Paraguayans | 98.6 /100 | #70 | Exceptional 4.3% |
| Palestinians | 98.5 /100 | #71 | Exceptional 4.3% |
| Whites/Caucasians | 98.4 /100 | #72 | Exceptional 4.3% |
| Canadians | 98.2 /100 | #73 | Exceptional 4.3% |
| Immigrants | Belgium | 98.2 /100 | #74 | Exceptional 4.3% |
| Kenyans | 98.1 /100 | #75 | Exceptional 4.3% |
| Slavs | 98.1 /100 | #76 | Exceptional 4.3% |
| Chileans | 98.1 /100 | #77 | Exceptional 4.3% |
| German Russians | 97.9 /100 | #78 | Exceptional 4.3% |
| Serbians | 97.9 /100 | #79 | Exceptional 4.3% |
| Cambodians | 97.8 /100 | #80 | Exceptional 4.3% |
| Immigrants | Micronesia | 97.6 /100 | #81 | Exceptional 4.3% |
| Eastern Europeans | 97.6 /100 | #82 | Exceptional 4.3% |