Mongolian vs Yugoslavian Child Poverty Under the Age of 5
COMPARE
Mongolian
Yugoslavian
Child Poverty Under the Age of 5
Child Poverty Under the Age of 5 Comparison
Mongolians
Yugoslavians
16.1%
CHILD POVERTY UNDER THE AGE OF 5
92.5/ 100
METRIC RATING
121st/ 347
METRIC RANK
17.2%
CHILD POVERTY UNDER THE AGE OF 5
54.1/ 100
METRIC RATING
172nd/ 347
METRIC RANK
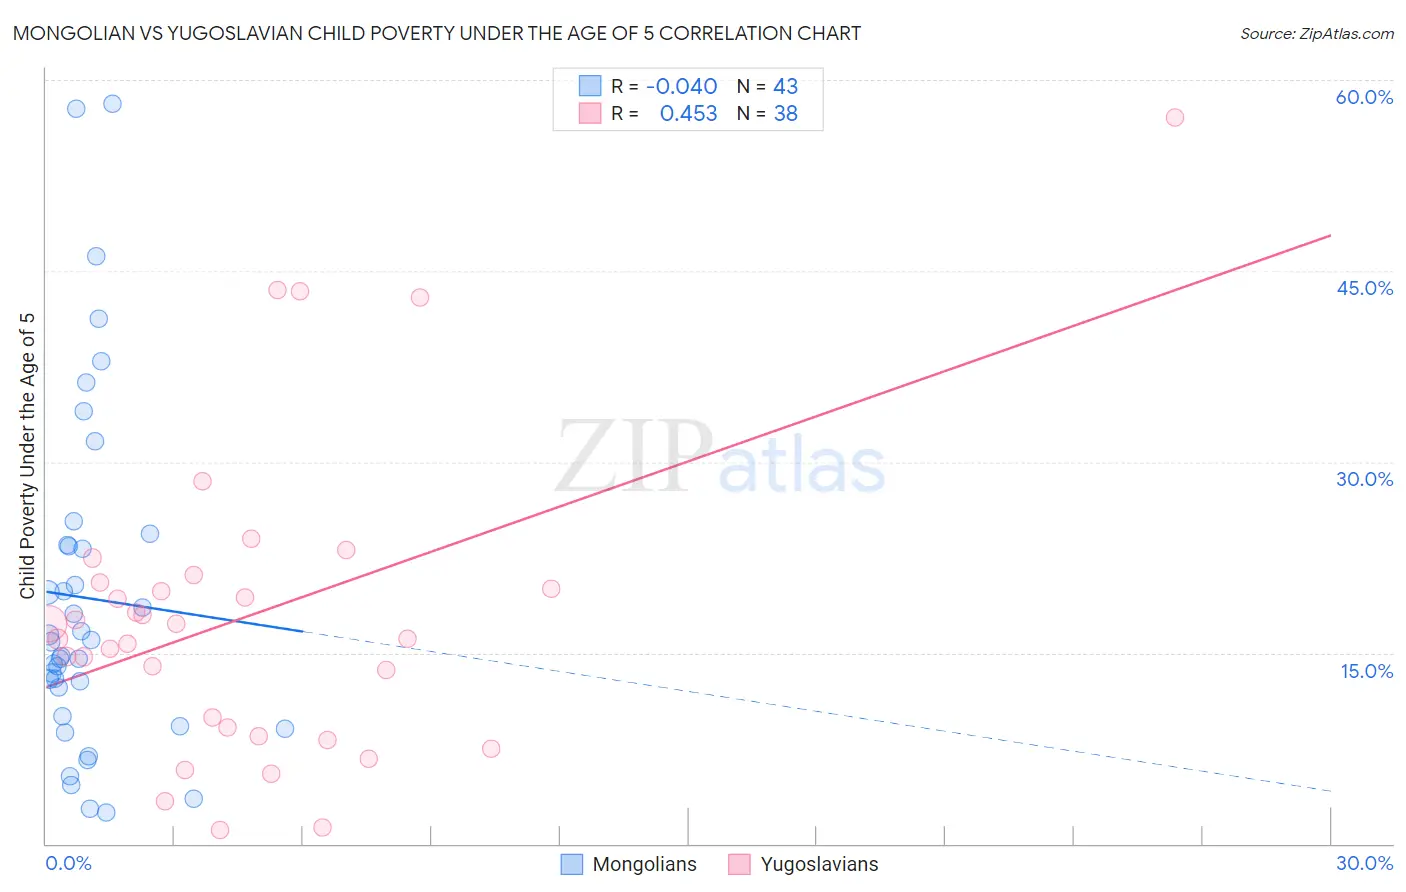
Mongolian vs Yugoslavian Child Poverty Under the Age of 5 Correlation Chart
The statistical analysis conducted on geographies consisting of 138,133,739 people shows no correlation between the proportion of Mongolians and poverty level among children under the age of 5 in the United States with a correlation coefficient (R) of -0.040 and weighted average of 16.1%. Similarly, the statistical analysis conducted on geographies consisting of 276,797,042 people shows a moderate positive correlation between the proportion of Yugoslavians and poverty level among children under the age of 5 in the United States with a correlation coefficient (R) of 0.453 and weighted average of 17.2%, a difference of 6.5%.
Child Poverty Under the Age of 5 Correlation Summary
| Measurement | Mongolian | Yugoslavian |
| Minimum | 2.4% | 1.0% |
| Maximum | 58.2% | 57.0% |
| Range | 55.7% | 56.0% |
| Mean | 19.3% | 17.9% |
| Median | 15.9% | 16.7% |
| Interquartile 25% (IQ1) | 10.0% | 9.1% |
| Interquartile 75% (IQ3) | 23.5% | 20.5% |
| Interquartile Range (IQR) | 13.5% | 11.4% |
| Standard Deviation (Sample) | 13.5% | 12.1% |
| Standard Deviation (Population) | 13.3% | 11.9% |
Similar Demographics by Child Poverty Under the Age of 5
Demographics Similar to Mongolians by Child Poverty Under the Age of 5
In terms of child poverty under the age of 5, the demographic groups most similar to Mongolians are Immigrants from Peru (16.1%, a difference of 0.010%), Immigrants from Southern Europe (16.1%, a difference of 0.20%), Austrian (16.1%, a difference of 0.22%), Swiss (16.1%, a difference of 0.23%), and Immigrants from Jordan (16.1%, a difference of 0.27%).
| Demographics | Rating | Rank | Child Poverty Under the Age of 5 |
| Immigrants | Kuwait | 93.9 /100 | #114 | Exceptional 16.0% |
| Albanians | 93.8 /100 | #115 | Exceptional 16.0% |
| Immigrants | Austria | 93.5 /100 | #116 | Exceptional 16.0% |
| Basques | 93.4 /100 | #117 | Exceptional 16.0% |
| Immigrants | Denmark | 93.4 /100 | #118 | Exceptional 16.0% |
| Immigrants | Jordan | 93.2 /100 | #119 | Exceptional 16.1% |
| Immigrants | Peru | 92.6 /100 | #120 | Exceptional 16.1% |
| Mongolians | 92.5 /100 | #121 | Exceptional 16.1% |
| Immigrants | Southern Europe | 92.0 /100 | #122 | Exceptional 16.1% |
| Austrians | 92.0 /100 | #123 | Exceptional 16.1% |
| Swiss | 92.0 /100 | #124 | Exceptional 16.1% |
| Native Hawaiians | 91.8 /100 | #125 | Exceptional 16.2% |
| Immigrants | Albania | 91.8 /100 | #126 | Exceptional 16.2% |
| Immigrants | England | 91.5 /100 | #127 | Exceptional 16.2% |
| South Africans | 90.1 /100 | #128 | Exceptional 16.2% |
Demographics Similar to Yugoslavians by Child Poverty Under the Age of 5
In terms of child poverty under the age of 5, the demographic groups most similar to Yugoslavians are Welsh (17.2%, a difference of 0.010%), Immigrants from Saudi Arabia (17.2%, a difference of 0.43%), Immigrants from Morocco (17.1%, a difference of 0.51%), Immigrants from Western Asia (17.1%, a difference of 0.54%), and Immigrants from South America (17.1%, a difference of 0.63%).
| Demographics | Rating | Rank | Child Poverty Under the Age of 5 |
| Immigrants | Colombia | 66.9 /100 | #165 | Good 16.9% |
| Slavs | 64.0 /100 | #166 | Good 17.0% |
| Immigrants | Uzbekistan | 62.0 /100 | #167 | Good 17.0% |
| Uruguayans | 60.5 /100 | #168 | Good 17.0% |
| Immigrants | South America | 60.0 /100 | #169 | Good 17.1% |
| Immigrants | Western Asia | 59.2 /100 | #170 | Average 17.1% |
| Immigrants | Morocco | 58.9 /100 | #171 | Average 17.1% |
| Yugoslavians | 54.1 /100 | #172 | Average 17.2% |
| Welsh | 54.0 /100 | #173 | Average 17.2% |
| Immigrants | Saudi Arabia | 50.0 /100 | #174 | Average 17.2% |
| Immigrants | Lebanon | 47.6 /100 | #175 | Average 17.3% |
| Immigrants | Iraq | 45.2 /100 | #176 | Average 17.3% |
| Immigrants | Sierra Leone | 43.6 /100 | #177 | Average 17.3% |
| Immigrants | Cameroon | 42.7 /100 | #178 | Average 17.4% |
| Hawaiians | 41.5 /100 | #179 | Average 17.4% |